wireless water meter
The purpose of this project was to have a way to monitor our water consumption at home, with minimal modifications to the existing installation.
- Introduction
- Existing installation
- Assembling the sensor system
- Installation
- Arduino code
- Initial wireless solution
- Data analysis
- Final wireless module
- Logging scripts
- Viewing data
- Misc notes
- Lessons learned
Introduction
There were several options to consider:
- replacing the existing meter with a new one equipped with data transmission capability: such meters are expensive, and must generally be associated to even more expensive data acquisition/transmission systems. Also, it requires replacing the original water meter, which I am pretty sure my water company would not allow.
- buying the sensor add-on specifically designed to go with my model of water meter (“HRI pulse unit” for Sensus 620): not intrusive, it plugs on top of the original meter, it is however expensive and requires a specific proprietary data acquisition system to read the data.
- building a custom readout device, attached where the proprietary add-on is supposed to go: I used this project as an opportunity to experiment with wireless sensors, especially after discovering a ton of interesting usecases on the mysensors.org site. Results are detailed below.
Existing installation
My existing water meter looks like this:
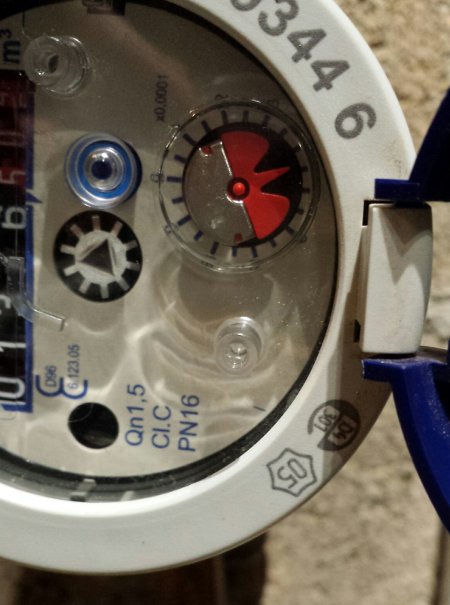
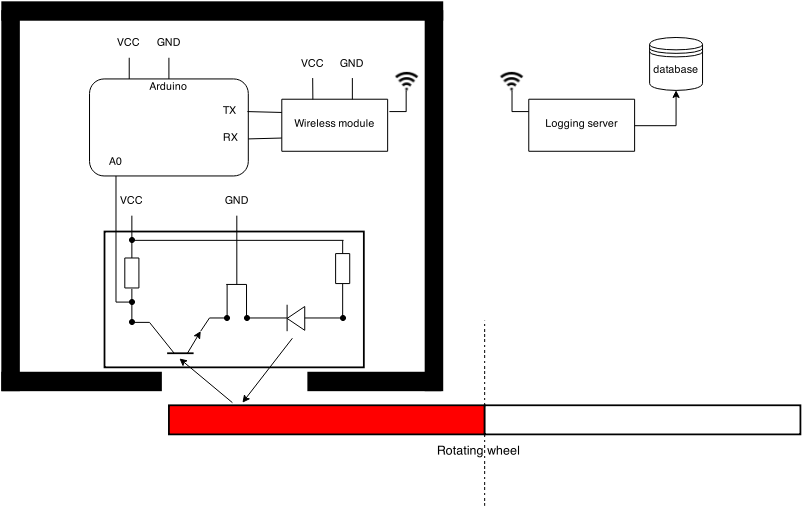
The interesting part is the half-red/half-silver wheel that spins when water flows through the meter. Putting an LED and photodiode above the border of this wheel allows to detect each turn of the wheel, simply by detecting the variations in reflected light. An Arduino is just fine to perform these continuous readouts, implement the counting of the total number of turns, and send this data over a wireless link to some logging server:
The two round plastic pegs will be useful for the mechanical alignment of the sensor on top of the wheel (more on this later)
Assembling the sensor system
The following parts are involved:
-
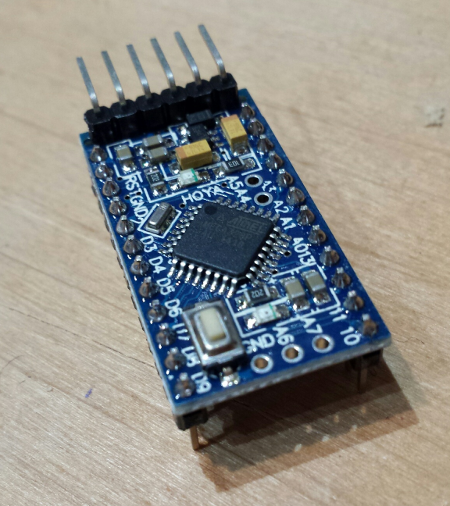
Arduino board, in my case I selected a Funduino pro mini, but any version will do:
-
a power supply for the arduino and sensor module: during tests I just supplied the arduino through a USB-FTDI cable (see here), which was also used to program the arduino. For the final setup, I used a separate 5V power supply. A battery pack could probably do the trick too, but since this device will be located in my garage, I did not want to bother changing batteries every now and then, nor did I want to optimize the setup for lowest possible power consumption (which would require a smarter arduino code, waking up from sleep upon an external event when the watermeter activates)
-
Light emitter & sensor: I chose to use a TCRT5000 module (less than 4$ at DealExtreme), it includes an IR LED with associated IR photodiode. The module I bought integrates the TCRT5000 along with an integrated voltage comparator (that I will not use) and a couple of LEDs and resistors. So the interface if quite simple: supply VCC (5V) and GND, and the analog value of how much light is getting received on the photodiode is available on pin A0:
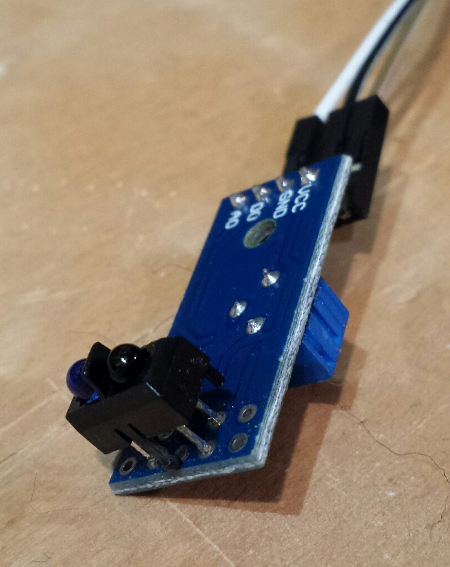
Note: the D0 output is the digital output of the voltage comparator, which threshold can be set with the onboard potentiometer. D0 ouput changes state when the threshold is crossed. In my case however, it turned out to be difficult to find an appropriate threshold that would correctly detect the wheel rotations, so I ended up using the analog output (A0) and implementing my own filtering/threshold detection logic in the arduino
Installation
Quick & dirty mounting plate
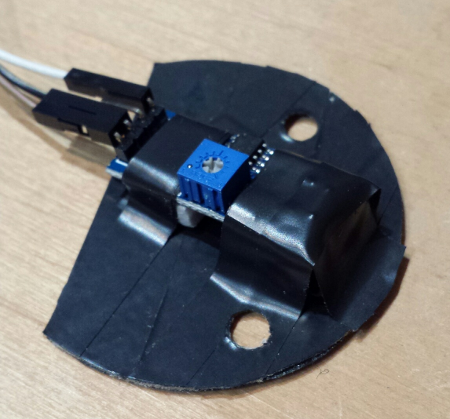
To ensure that the sensor would be properly located right above the border of counting wheel, I cut a plastic mount plate fitting the original meter shape and plastic pegs positions, then taped the sensor on top of it. Here is a view of the top:
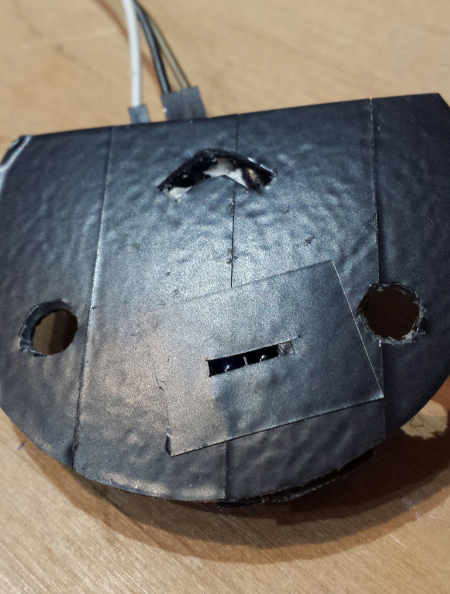
And here is a view of the bottom, with the small opening for the IR LED & photodiode. I used black tape and a small opening window, to minimize the influence of external light on the measure.
Finally, here is a view of the device mounted on the water meter:
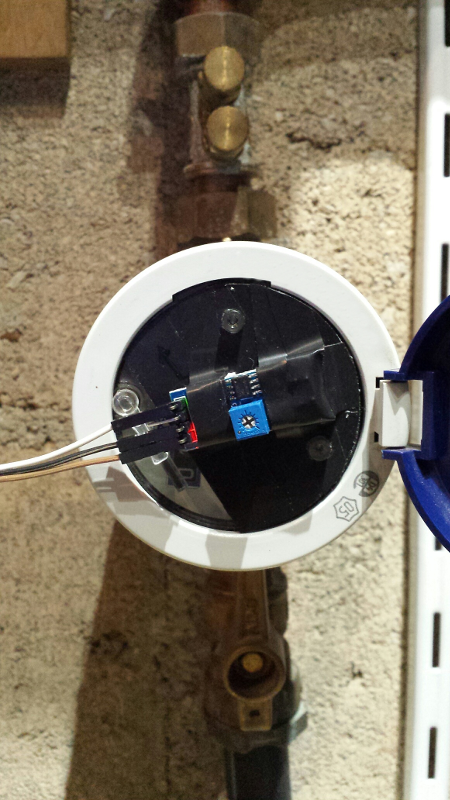
The two plastic pegs ensure that the device does not move during measurements, yet it can be easily removed if needed.
Better mounting plate
Even though things worked just fine with the mounting plate described above, I used this as an opportunity to experiment with online 3D printing. Below are two views of the 3D model I created using Sketchup Make:

The sunked surfaces are there to accomodate the few solder pins that are present on the bottom of the TCRT5000 module PCB
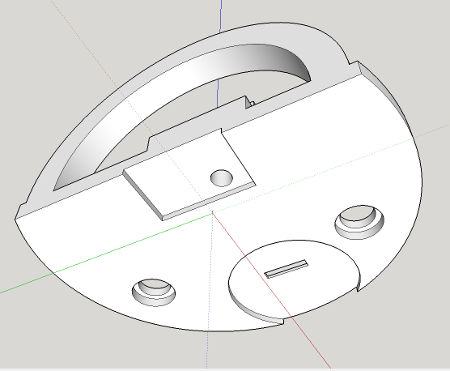
The square and circular sunked surfaces are there to accomodate the bumps present on the sensus 620’s front plate, so that the holder can stick perfectly.
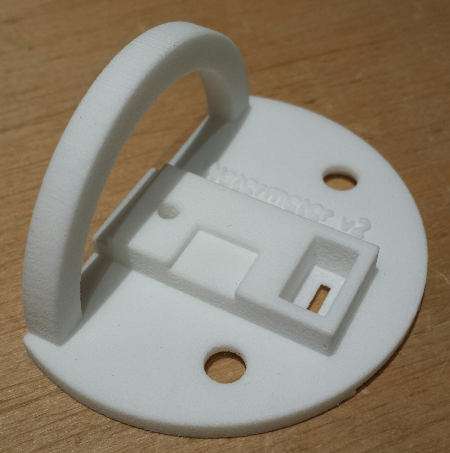
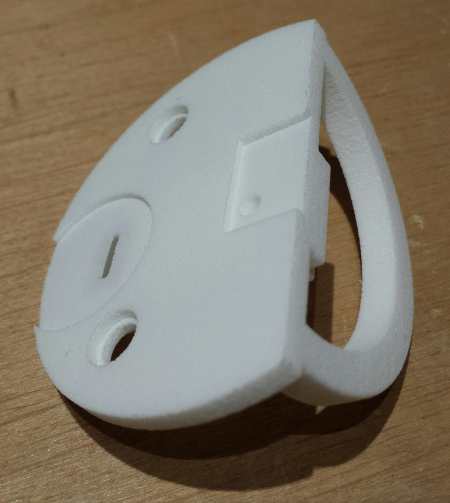
I then used a Sketchup extension to export the Sketchup model to a 3D-printing-friendly STL file, uploaded it on an online printing service (Sculpteo.com), and got it printed for about 10 dollars.
Both the Sketchup model and the exported STL file are available here.
I was actually pleasantly surprised by the result: the surface finish is decent, and the plastic is quite stiff.
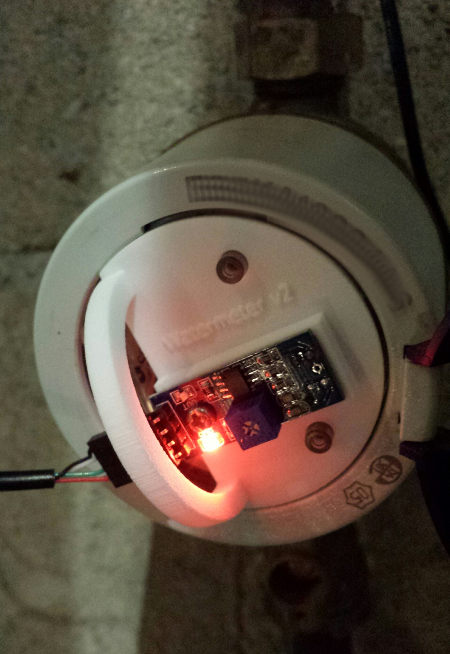
Here it is, mounted on the watermeter with TCRT5000 sensor
Arduino code
The analog output from the photodiode is inversely proportional to the amount of reflected light:
- if no light from the IR LED is reflected onto the photodiode at all, the diode is blocking, hence A0~=VCC
- if all light from the IR LED is reffected onto the photodiode, the diode is passing, hence A0~=GND
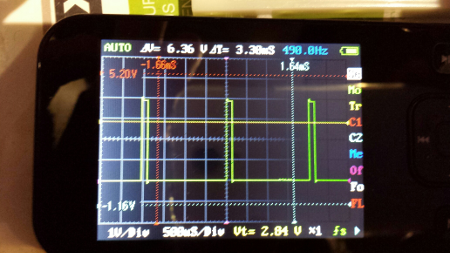
The initial test code below allowed to visualize readouts from the photodiode directly on a oscilloscope: the analog value from the photodiode is read on pin A0, which provides a value between 0 and 1023. The value is then divided by 4 to fit in the 0-254 range, it is the written to the output pin 11 which happens to work as a PWM output: the duty cycle of the signal on pin 11 will vary depending on the input analog value:
const int pwm_output =  11;
int tcrt;

void setup() {
  pinMode(pwm_output, OUTPUT);
}

void loop(){
  tcrt = analogRead(A0);
  analogWrite(pwm_output, tcrt/4);
  delay(250);
}
When the LED/photodiode is on top of the silver part of the wheel, most of the light is reflected, the analog value is very low, and the PWM signal has is high only for a very small portion of time:
When the LED/photodiode is on top of the red part of the wheel, the reflected light is much less, the analog value is higher, therefore the PWM signal stays longer at the high level:
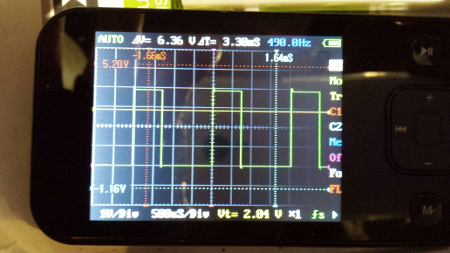
I used this to verify that I would get enough difference between the value for the red part and the value for the silver part. It turns out that the difference is quite sensitive to sensor positioning errors and to the size of the opening in front of the photodiode.
Initial wireless solution
To experiment with remote data transmission, I started with using a Bluetooth module (this JY-MCU version) connected to the Arduino.
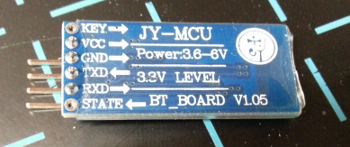
The wiring is extremely simple: connect VCC, GND, and RX and TX (respectively to TX and RX of the Arduino). When powered, the red led on the module should blink (i.e. module is waiting for association). Out of the box the device is ready to use, but should you need to reconfigure it, instructions to connect to it with an FTDI cable are available in this project
On the Arduino side, communicating with the Bluetooth module is trivial: just use the Serial library. The code becomes:
int tcrt;

void setup() {
  Serial.begin(9600);
}

void loop(){
  tcrt = analogRead(A0);
  Serial.println(tcrt/4);
  delay(250);
}
On the (linux) host side, I used a USB bluetooth adapter, connected to the bluetooth module using Ubuntu bluetooth manager and initial pin code “1234”. Then from the command line:
-
find the bluetooth device’s MAC address using
hcitool scan -
modify
/etc/bluetooth/rfcomm.confto specify MAC address and name the device:
rfcomm0 {
	bind no;
	device (MAC address here);
	channel 1;
	comment "WaterMeterBluetooth";
}
- connect to the device:
sudo rfcomm connect 0At this point, the shell should display:
Connected /dev/rfcomm0 to (MAC address) on channel 1
Press CTRL-C for hangup
and the led on the bluetooth module should not blink anymore.
- finally, to get the data from the bluetooth device, open a serial terminal (e.g. minicom) on port
/dev/rfcomm0at speed 9600 Bauds.
Measured values should be displayed regularly.
Data analysis
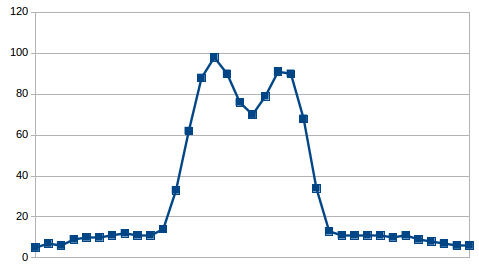
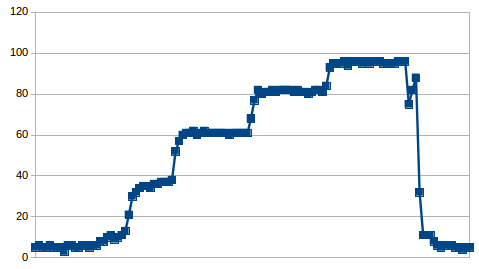
I logged these output values, and let the capture run while using the water normally. At the configured acquisition rate of 4 samples per second (250ms delay in the code), when the water flow is moderate, one rotation corresponds to the following curve:
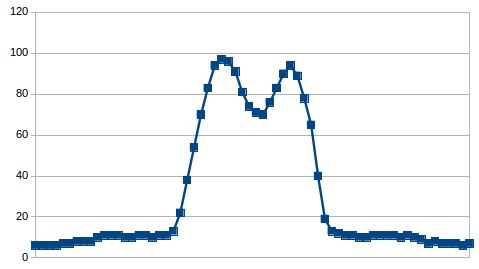 Values below 20 correspond to the time when the sensor sees the silver part of the wheel, while the two peaks correspond to the pointy red part passing in front on the sensor. So far, so good, there is a clear distinction between both zones. But since acquisition rate is slow, when the water flow increases and the wheel spins faster, there are less and less measures points in the peaks:
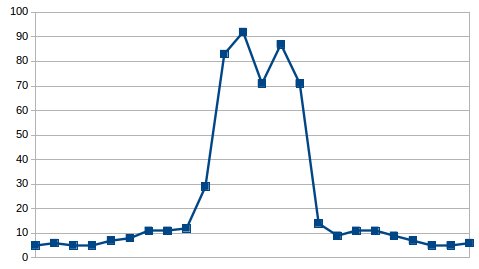
faster….
even faster…
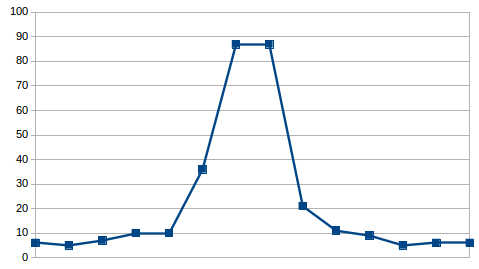
This is the worst case / fastest case I noticed, and the peaks only contain two samples. Therefore I decided to increase the acquisition rate, from 4 to 10 Hz, by reducing the delay to 100ms between readouts.
Other interesting cases happen depending on where the wheel was when the water flow stopped:
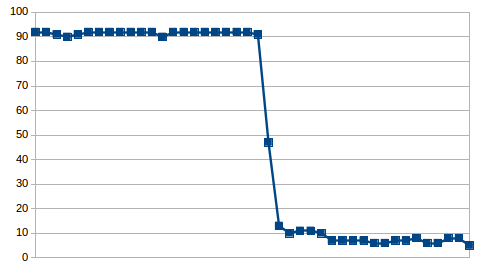
(water flow stopped right when reaching the peak…then restarted later)
(successive short bursts of water flow)
With this data available I set two thresholds for the counting logic:
- a high threshold to detect when the sensor enters the red zone
- a low threshold to detect when the sensor enters the silver zone: this is when we notify that one turn has been completed.
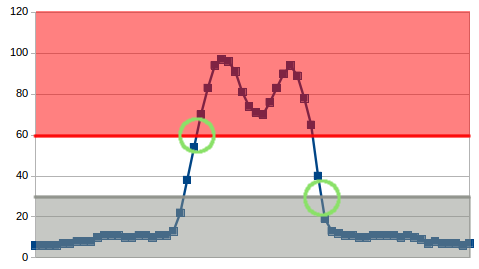
Both thresholds are separated to have an hysteresis effect, to prevent counting possible oscillations around one of the thresholds as multiple turns.
Once the counting of wheel turns is in place, the only remaining thing is to convert the number of turns into a volume of water: in the case of my sensor, one turn = one liter.
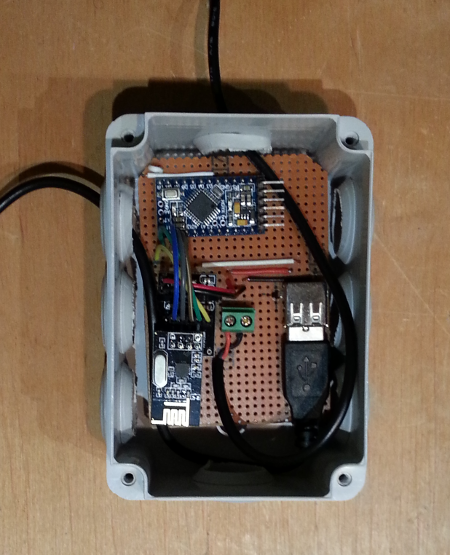
Final wireless module
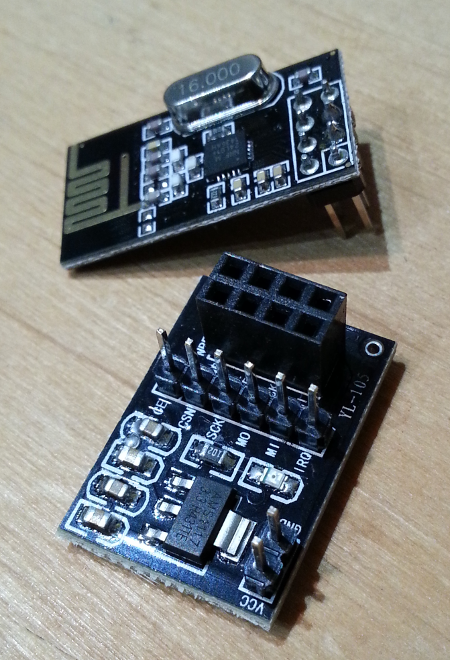
Bluetooth module was working fine, but was a bit of an overkill to be the permanent solution for this project, so I moved to cheaper/simpler nRF24L01 radio modules for the final setup. Also, this will enable additional sensors to be used, since the nRF24L01 is multi-channel capable. The nRF24L01 module is supplied with 3.3V power, and since the Funduino pro mini only provides 5V, I also used a 5V to 3.3V adapter. Both are shown below (nRF24L01 at the top, adapter at the bottom):
The overall cabling, both on the emitter side (Funduino & TCRT5000) and on the receiver side (Raspberry pi) is shown below:
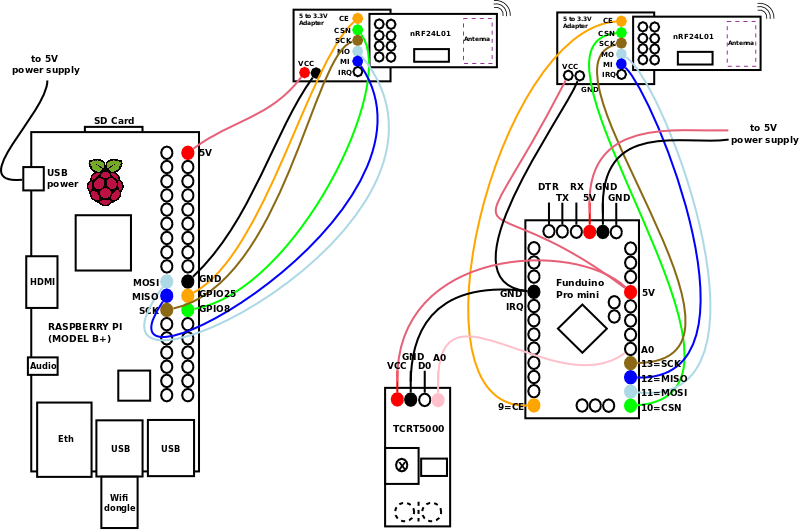
Note: on the raspberry side, even though 3.3V is available on the GPIO connector, I also used a 5V/3.3V adapter like on the Arduino side. I initially connected the 3.3V directly, but found out that the range of the wireless link was largely degraded. The nRF24L01 appears to be quite sensitive to the quality of the input 3.3V supply, and the adapter’s regulator allows to have a cleaner 3.3V supply.
Below is a view of the arduino part, integrated inside a small box that is then mounted near the water meter (the USB connector/cable goes to the TCRT5000 module, I just used the 4 available wires in the cable, and happened to have a spare female USB connector lying around. The cable on the left is the 5V power supply)
Software install on the arduino side
I downloaded the RF24 library here as a zip file then from the Arduino IDE, imported it (Sketch / Import library / Add library… then navigate to zip file)
Software install on the raspberry side
As usual, everything begins with installing a default Raspbian distribution from raspberrypi.org
1) transfer raspbian image to SD card:
sudo dd bs=1M if=XXX-raspbian.img of=/dev/xxx
2) plug-in a mouse/keyboard/HDMI display and boot-up
3) Use raspi-config to configure the raspberry as required (e.g. keyboard layout) / Select the correct time zone (In Internationalization options => select appropriate area and city) and enable SPI from the Advanced options menu
4) Plug wi-fi dongle, boot to graphical environment, configure wifi settings.
Once this is done, a few additional actions are required for our setup:
- (OBSOLETE) on older raspbian distributions, SPI should be enabled it by editing the file
/etc/modprobe.d/raspi-blacklist.conf:
sudo nano /etc/modprobe.d/raspi-blacklist.conf
and commenting out the line spi-bcm2708. Then reboot or load the SPI module with
sudo modprobe spi-bcm2708
- Installing python-dev libraries (required for spidev compilation)
sudo apt-get install python-dev
- Installing spidev for python:
git clone https://github.com/doceme/py-spidev
cd py-spidev/
sudo python setup.py install
Finally, and as I usually do, I chose python for the raspberry side of the code. I reused a python library for the RF24 modules from here, I archived it here. I just put this nrf24.py file alongside my python script, for the sake of simplicity.
The apscheduler python library is also required:
sudo apt-get install python-pip
sudo pip install apscheduler
As well as the requests library for remote logging
sudo pip install --index-url=https://pypi.python.org/simple/ requests
Logging scripts
This great page conveniently provided both an Arduino sketch and a corresponding python script for the raspberry side.
After experimenting a bit I settled on the following:
- on the Arduino side, the
watermeter.inosketch boils down to a loop continuously monitoring the light level from the sensor, implementing the hysteresis thresholding described in the data analysis section above, and writing a string over the wireless link when a threshold crossing has been detected. - on the Raspberry side, the
watermeter_logger.pyscript continuously listens for incoming messages over the wireless link, and increments a local counter when a message is received. A background task triggered at a specific frequency, logs the accumulated value over the corresponding time period. This script is associated to thewatermeter_logger.iniconfig file, storing the log file path and logging period. Finally, thewatermeter_logger_shis the startup script allowing to make the waterlogger a background daemon:
sudo cp watermeter_logger.sh /etc/init.d/watermeter_logger.sh
sudo chmod a+x /etc/init.d/watermeter_logger.sh
sudo update-rc.d watermeter_logger.sh defaults
In addition to logging the value locally in a file, the script also logs the value remotely on a data logging server using an HTTP POST request, which payload is of the followinf format
homelogdata,graph=waterMeter value=1.23456
homelogdata is the name of the measurement/data series into which the value is to be inserted, while graph tag is set to waterMeter to allow to later filter on these specific water-meter related values if necessary.
All files are available here.
Viewing data
I wanted to integrate the ability to display logged data over of specified period of time in my HomeHubTablet display, so I developed an Android graph viewer widget to achieve this.
Misc notes
Over time, I noticed intermittent (~once a month) robustness issues on the nRF24 library on reception side (on raspberry pi), where the script would stop detecting messages after a while, and just restarting the service would fix the situation. As a workaround, I implemented a cron job to automatically restart the service nightly, by adding this line in the crontab:
0 3 * * * /usr/sbin/service watermeter_logger.sh restart >> /home/pi/waterrestart.log 2>&1
Lessons learned
- Arduino + Raspberry is a great little combination, that lends itself quite naturally to the usecase of acquiring raw data from a sensor, transmitting it over a wireless communication link, and finally receiving and processing it as appropriate using a higher level language and enabling further web connectivity.