Graph viewer widget for Android
After developing the wireless water meter, I wanted to have an associated graphical front-end to visualize the water usage history. The obvious choice for my context was to develop an Android-based application so as to be able to integrate this graphical viewer in our home hub tablet. As for other applications already hosted on this tablet (e.g. PostitListWidget or ShoppingListWidget), I decided to implement this viewer as a widget, not a regular android app. This makes things significantly more complex to develop, but this is balanced by the convenience to have all information available at all times on a unique screen (no need to explicitly launch/exit an application manually), which I think makes more sense for a screen on the wall.
Overview
The overall setup involves:
- a data logger (the wireless water meter from this project), modified to send its data to a remote data server.
- a data server to store this incoming data from the logger.
- the android widget to get a requested subset of data from the server, and display it on screen.
I chose to host these three functions in three separate devices, that were already part of my home setup:
- the data logger runs on a dedicated raspberry Pi, within radio range of the watermeter.
- the data server runs on my main raspberry Pi.
- the data viewer widget runs on the android wall tablet.
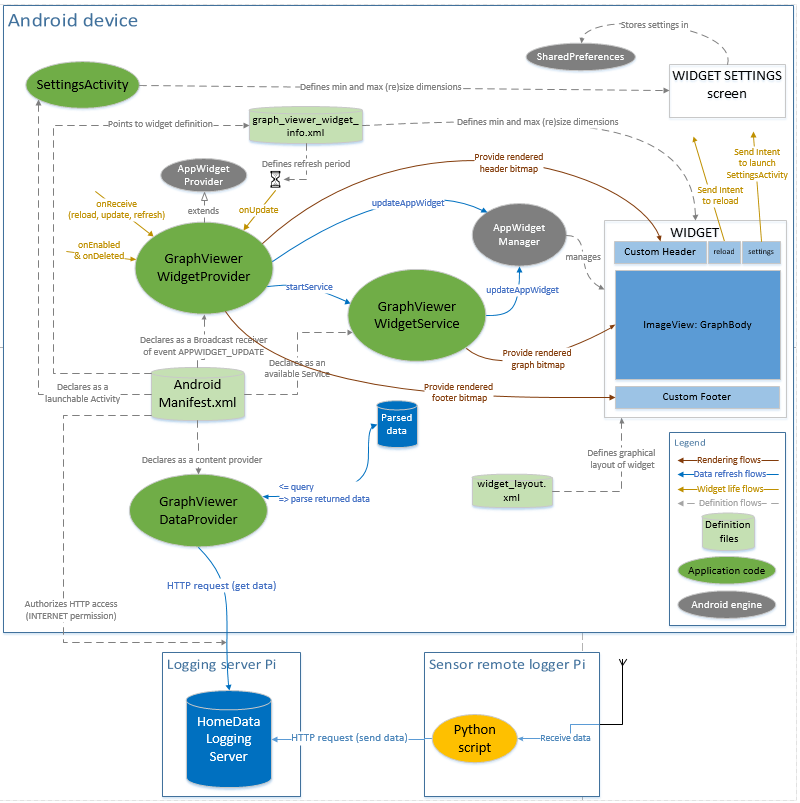
Below is the overall implementation logic (don’t freak out):
Data server
The widget queries data from a remote data server, which setup is documented here.
Data logger
One source of incoming data is a slightly updated version of the watermeter logger (see here), modified to perform an HTTP request on the data server to pass along the computed value (nb of liters consumed in the last 5 minutes). It boiled down to adding and using this python function:
import urllib
import urllib2

def remoteLog(valueToLog):
	logger.info('Logging remotely...')
	data = 'homelogdata,graph=waterMeter value='+str(valueToLog)

	req = urllib2.Request(REMOTELOG_URL, data)
	req.add_header('Content-Length', '%d' % len(data))
	req.add_header('Content-Type', 'application/octet-stream')

	try:
		response = urllib2.urlopen(req, timeout=5)
	except urllib2.HTTPError, e:
		logger.info('HTTPError: '+ str(e))
	except urllib2.URLError as e:
		logger.info('URLError: '+ str(e))
	else:
		result = response.read()
		logger.info('successfully logged data (' + data + ') remotely')
Another source of data is a python script performing a basic monitoring of my LAN devices ping status (nothing noteworthy, it just pings a predefined list of devices and logs the result in the data server, logging 1.0 for a successful ping and 0.0 for a failed ping (the source code is here)
Android widget
Preliminary notes:
- since I intended to integrate the resulting widget in my home hub tablet, which happens to run Android 4.0.3, I cannot rely on any feature not available in API level 15.
- the code was originally kickstarted using this guy’s code that implements a nice Android battery status monitoring widget.
- the provided code is wrapped in an Android Studio project (using version 1.3.1 at the time of writing)
Android manifest
Each android widget starts with a manifest file, like for regular android applications. The manifest includes:
- the declaration of a Widget Provider class, acting as a broadcast receiver to handle the widget update notifications from Android. This declaration includes a reference to the file providing some parameters of the widget (here,
graph_viewer_widget_info.xml):- the refresh period for the widget, in
updatePeriodMillisparameter; Android enforces 30 minutes as a minimum. - the min and max size of the widget on screen in case of user resize action.
- the refresh period for the widget, in
- the declaration of a Service class that will provide/adapt the RemoteViews for displaying the widget.
- the declaration of an Activity class to manage the settings page that a widget can optionally provide.
Widget layout
The graphical layout is defined as follows:
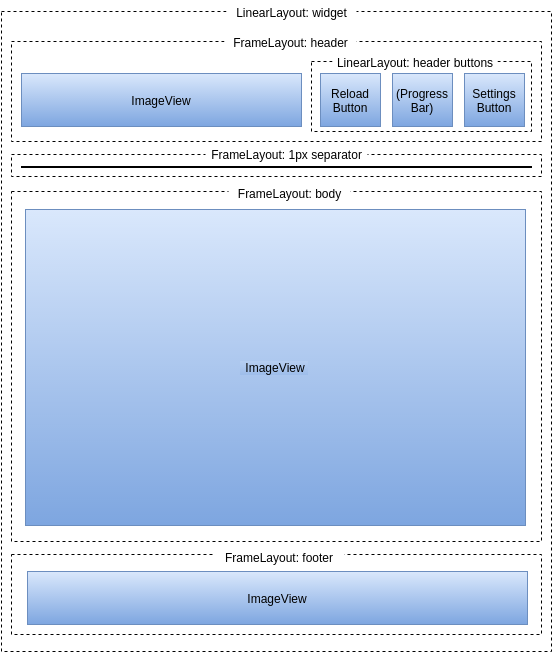
- in the header section:
- the ImageView will be dynamically rendered with specific text.
- the settings button is always visible.
- the reload button is visible by default, and then is hidden while a reload is in progres, being replaced by the progress bar (progress wheel, really) during that time.
- the separator section for now just contains a 1px-height line, but could be made to be a more fancy info bar or whatever.
- the body section will contain the graph to be displayed, rendered as a single ImageView.
- the footer section contains a single ImageView that will be rendered dynamically to include timestamp markers (text and vertical lines)
GraphViewerWidgetProvider
The declared WidgetProvider-derived class manages the lifecycle of the widget:
- it implements appropriate actions to be executed when the widget is installed/removed by the user, in
onEnabled/onDeletedcallbacks. - it registers a graphical layout definition to the Android widget management framework.
- it registers specific
PendingIntentson the clickable buttons (i.e. it defines which event will be sent to the widget when user clicks this button) - it renders the header and footer bitmaps
- those are usually static/predefined, with no need for the widget provider to do anything specific
- but in my case, both the header and the footer have dynamic text & graphics, so the corresponding ImageView object must be rendered.
- the header contains rendered text, showing the time the data was last refreshed.
- the footer contains text rendering of the vertical time markers/timeline.
- it delegates the gathering of data and rendering of the graph to the GraphViewerWidgetService, through a
startServicecall - it manages incoming events
- update requests (from Android, following the requested update period)
- reload requests (triggered by the reload button on the widget)
- refresh requests (triggered internally after settings have been changed)
GraphViewerWidgetService
This is where the bulk of the job is done:
- it performs a query on the data provider, and receives a JSON-structured set of raw data (“raw” in the sense that values for different graphs are mixed up, since they are ordered in the order they were logged to the server).
- it parses the result, transforming the received JSON structure containing all unsorted data values into data values sorted by
dataIdkey. - each individual graph is rendered onto the same Bitmap object/buffer, using the Android
CanvasAPI (providing very basic functions to draw lines, boxes, texts, …). This bitmap is then set as the source for the mainImageViewinside theRemoteViewsrepresenting the widget. - I currently implemented two types of graphs:
- bargraph, with automatic vertical scaling based on the maximum value in the dataset over the displayed period of time
- with automatic display of cumulated value for each of the 16 sub-periods
- and an additional ability to specify a given time range of interest, where the cumulated value is computed and displayed (say, to monitor daily water consumption between 6am and 8am)
- binary graph, drawing a unique horizontal strip that is either green when value is 1.0, or red when value is 0.0
- bargraph, with automatic vertical scaling based on the maximum value in the dataset over the displayed period of time
- A major difficulty I had was just to figure out the width and height of the graph to be rendered, since I am rendering bitmaps. For the life of me, with Android API 15 I dit not find any way to programmatically get the exact current height/width of the widget, so I implemented an ugly but efficient workaround:
- set the widget layout parameters so that the rendered images are stretched horizontally to the widget’s width.
- use a default width/height.
- register a callback on the ImageViews I need the dimensions of.
- when one clicks on these ImageViews, these callbacks are invoked and it is then possible to call
getSourceBounds, which contains the width and height of the source ImageView. - store these width/height values in the application’s
SharedPreferences, so that they become the default values. - this ensures that rendering in each of the three ImageViews is done with the exact pixel size of the rendered widget on screen, avoiding any scaling artefacts.
GraphViewerDataProvider
This class encapsulates the remote/network access to get the actual data for the graphs from the data server. It performs an HTTP POST request, and receives a JSON formatted structure, which it then parses to fill a Cursor object, with one row per data item. The Cursor object is what gets returned to the GraphViewerWidgetService. The query specified inside the POST request contains the value of the time delay to cover, in hours:
SELECT * FROM homelogdata WHERE time > now - [delay]h
effectively returning all entries between [delay] hours ago and the current time.
The URL for a request of the last 3 days, would for example look like this:
http://[IP]:[port]/query?db=homelog&q=SELECT+*+FROM+homelogdata+WHERE+time+%3E+now%28%29+-+72h
SettingsActivity
This class is derived from Android’s PreferenceActivity, and implements the (full screen) page that pops-up when one clicks on the settings icon of the widget. Upon creation, this activity loads the graph_settings.xml layout definition file, which structure is:
<PreferenceScreen >
  <PreferenceCategory>
    <EditTextIntegerPreference/>
    <ListPreference/>
  </PreferenceCategory>
</PreferenceScreen>
This defines a single preference/settings screen, containing a single category/section, containing a single setting: a multiple-choice list for defining the graph’s history depth. The history depth list values are defined in array.xml, it defines both the list of text to be displayed (the available durations), and the list of associated numerical values (hours)
<string-array name="history_length_display">
<item>8 hours</item>
<item>12 hours</item>
<item>1 day</item>
<item>2 days</item>
<item>3 days</item>
<item>1 week</item>
<item>1 month</item>
</string-array>

<string-array name="history_length_values">
<item>8</item>
<item>12</item>
<item>24</item>
<item>48</item>
<item>72</item>
<item>168</item>
<item>720</item>
</string-array>
In addition, the onBuildHeaders function is overridden to reference the settings_headers.xml:
<preference-headers>
  <header/>
</preference-headers>
which references a single preference header, implemented by the GraphSettingsFragment in the code.
Finally, the retrieved settings values are managed in a GraphSettings class used in the rest of the code.
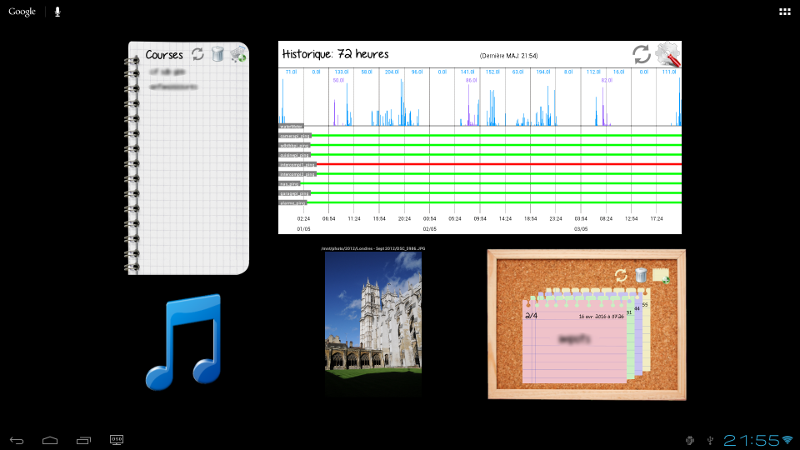
Results
Below is a capture of the android widget, showing the daily water consumption (in blue), the specific water consumption in predefined time slots (in purple), and the view of ping statuses of the various raspberry pi around the house:
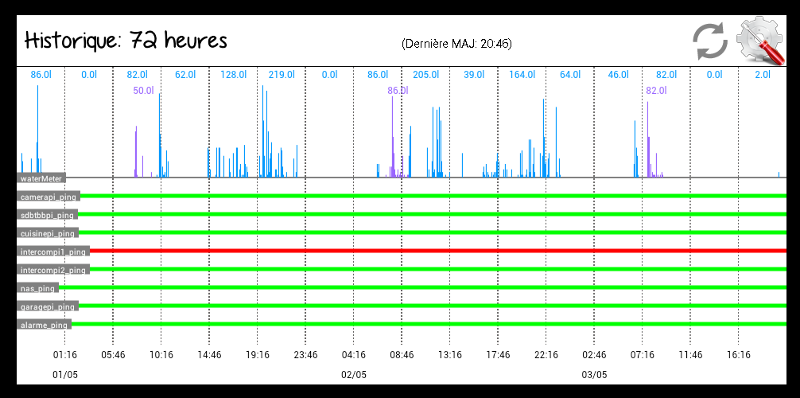
And here it is integrated in my home hub tablet:
Lessons learned
- Android widget mechanics are slightly convoluted, and widgets are much more restricted (by design) than regular android apps. I gave up on finding a robust way to get the current size of the widget programmatically, and with this Android API version.
- I still like them better for this kind of use though (and deriving a 2nd widget is easy once the initial effort has been done)
- Manually rendering a custom bitmap via the Android Canvas API is easy enough for very simple graphics like this.
- I originally implemented the graphs as a ListView containing individual ImageViews, rendered individually. On low-performance android device, this turns out to be inefficient, and buggy (partially refreshed list). Rendering all sub-graphs into a single Bitmap is much more efficient, even though it requires a bit more code to get things at the right place in the graph.
- For storing and retrieving timestamped data efficiently, do yourself a favor and use a time-series database instead of a general purpose database