Auto-computed values in Visio diagrams with VBA
I’m using Microsoft Visio quite often at work, and came to realize that it can do so much more than drawing nice diagrams. I was not aware of the very large developer community around Visio either.
Anyway, I had a need for:
- associating data to shapes in my diagrams
- performing automatic data computation within Visio, without having to export/import to/from an external tool
- displaying resulting data directly on the diagram
My specific intent was to apply this to electronics/mechanical block diagrams to provide instant visual feedback about cost, power consumption, volume, and mass, as a function of what components were added/removed from the diagram, and how they where interconnected.
- Application
- Underlying Visio mechanisms
- VBA implementation notes
- General Visio Tips
- Useful resources
- Lessons learned
Application
Overview
The resulting sandbox I experimented with, as well as VBA implementation notes (in excruciating details, mostly as a memo to myself) are provided below.
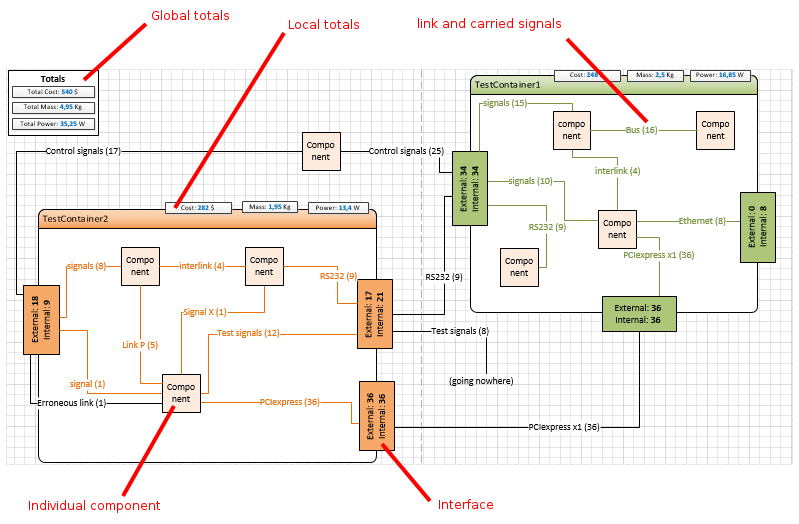
- Components each have their own cost/mass/power consumption/volume, assigned through shape data window.

- Connectors link components with each other, and they each have one associated data: the number of physical signals carried by this link (think “number of individual wires”)
- Containers allow to group Components, e.g. to represent the electronics components being part of the same PCB.
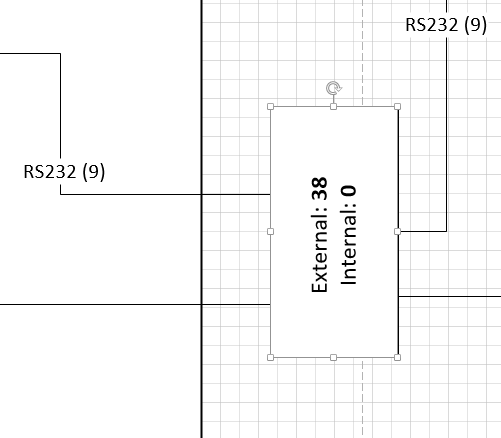
- Interfaces are used to structure incoming/outgoing connectors to/from a container. They automatically count (and display) the number of connectors that are inside the container (think “PCB traces”) and the number of connectors that are external (think “external cables/wires”).
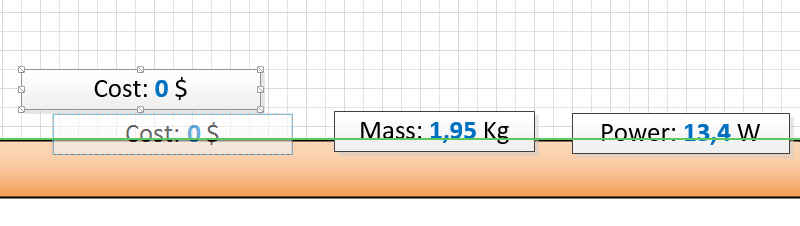
- Local (container) totals are boxes that automatically compute the sum of values of contained shapes, for the criteria that they track (i.e. cost, mass, power, or volume).
Note: I positioned these text boxes on the edge of the container, not inside (the container’s perimeter is highlighted when a shape is about to be dropped on its edge). This way, the boxes are still part of the container, but it also ensures that they stay attached to the container’s edge whenever it gets resized, which I think makes more sense for something showing data linked to the container’s content.
- Global totals are boxes that automatically compute the sum of values for all shapes on the diagram, for the criteria that they track (i.e. cost, mass, power, or volume).
Additional features
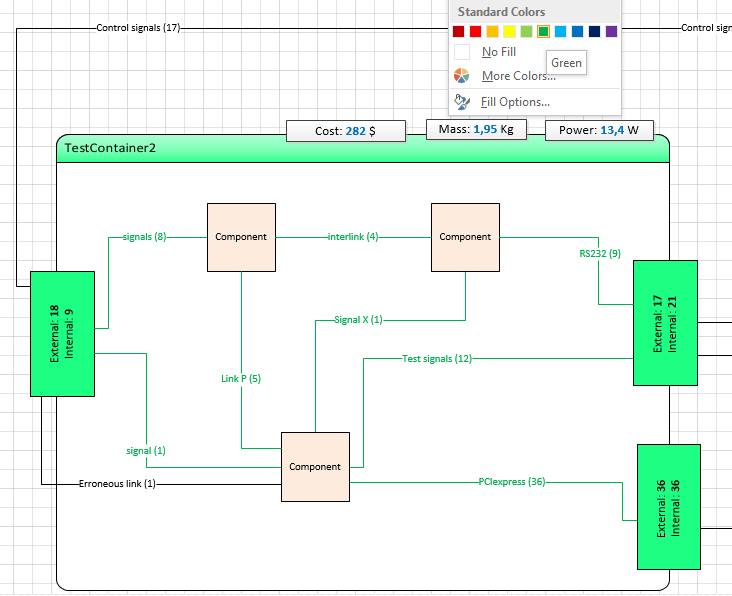
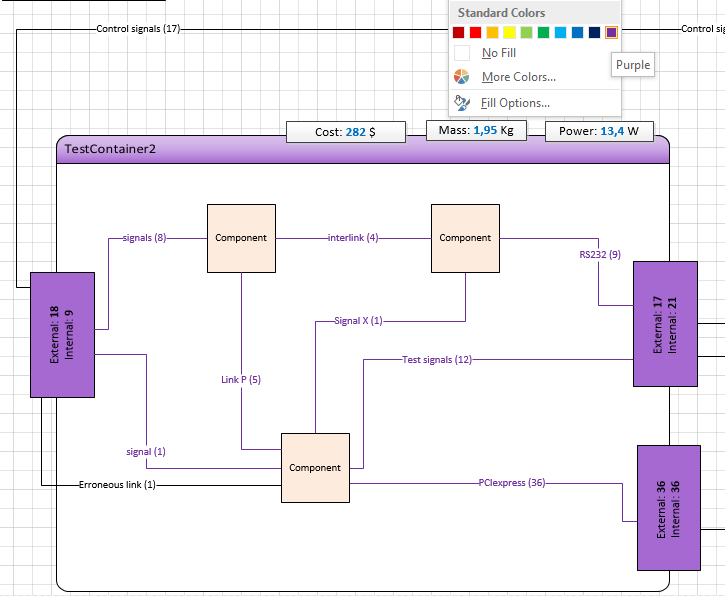
- automatic coloring: adjustement of internal connectors and interfaces color to the color of their container
- automatic computation of total internal/external signals on each Interface
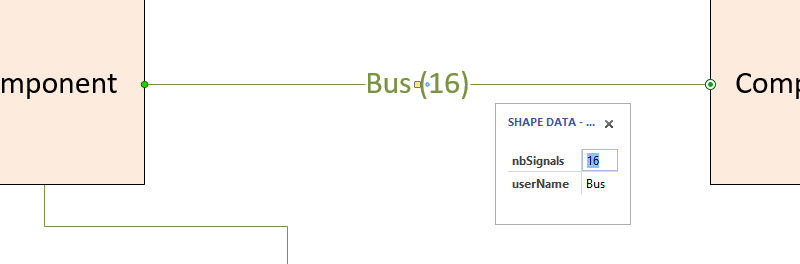
- the nb of signals carried by a connector is inserted in the connectors’ text (while hiding it during text edition by user)
Underlying Visio mechanisms
Associating data to shapes
The Professional version of Visio has a specific feature to simplify this usecase (“data graphics”), but I usually only have access to the Standard version, so I had to find a workaround. Fortunately, all versions of Visio provide a basic feature for associating user data to shapes. To access a specific shape’s date, right-click on it => “Data” => “Shape Data”. Data of various types (integer, float, string, …) can be created from there.
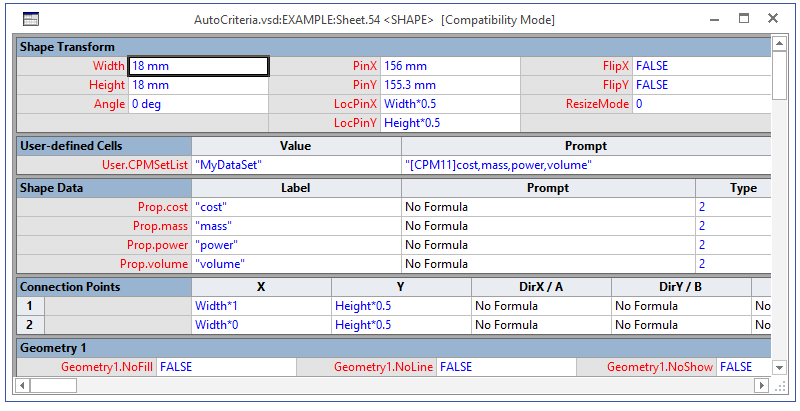
In this example I manually added some cost/mass/power/volume shape data to a basic “component” shape.
Better yet, to apply a consistent set of data to multiple shapes, it is possible to create a shape data set: right-click on Shape Data window => “Shape Data Sets”.
In fact, these user-created data are only a small subset of the data associated to a shape: each shape also has by default a lot of built-in data that Visio uses to store information about the shape (geometry, content, format, …). This whole set of data is available in the Shapesheet, accessible from the Developer tab of the UI (you may need to customize the Ribbon to make this Developer tab visible):
My specific need was creating summary data for a set of shapes, based on the combination of individual shape data (in this case, just a sum of the individual cost/mass/volume values). The most convenient way I found was to use visio Containers to group shapes. Containers are shapes too, so they can have associated data.
Computing shape data
The remaining part was then to find a way to compute container data, from the individual data of the shapes it contains. There are several ways to manipulate data programmatically in Visio:
- writing formulas directly within the ShapeSheet
- VBA macros/procedures (Visual Basic for Applications)
- C# code
- and more…
ShapeSheet formulas can be just fine for simple computations, but I chose VBA to have a bit more flexibility / readability.
Navigating shape connections
Sooner or later, it will be interesting to compute data for a shape based on what other/shapes are linked to it via Connectors. Visio has two important concepts:
- A shape is connected to another shape when at least one connector exists between them
- A connector endpoint can be glued to a shape
For example:
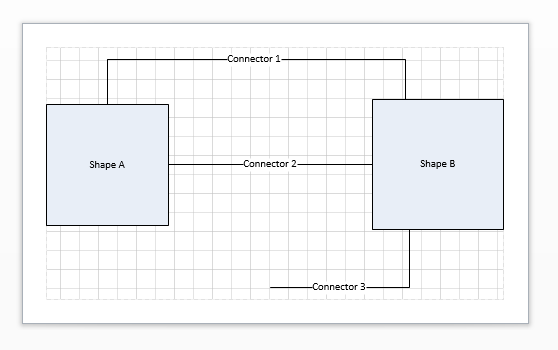
- Shape A is connected to shape B
- Connector1 and 2 are glued to shapes A and B
- Connnector3 is glued to shape B
Displaying results
Since the Standard version of visio does not have the Data Graphics feature, I chose a simple workaround: adding specific shapes (boxes) in the container, which text will be updated to reflect the value of the container’s data.
The trick is to associate one shape data to these boxes, and then to insert a custom text field as the text for the box: from the Insert tab, select ‘Insert’ / ‘Field’ / ‘custom field’ and type =Prop.xxxx with ‘xxxx’ being the name of the shape property (data) to be displayed.
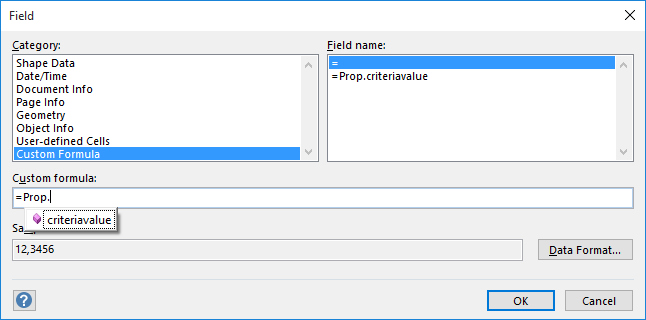
As a result, the box’s text will now reflect its shape data value whenever if changes.
Another possible alternative would be to use custom callouts, also available in visio standard, and allowing to display shape data values.
Visio projet file and VBA source code
The Visio example file and VBA classes source code are available here for reference.
VBA implementation notes
Visio object model & base concepts
The relevant entities that we manipulate for this usecase are shown below (representing a very limited subset of the full Visio object model):
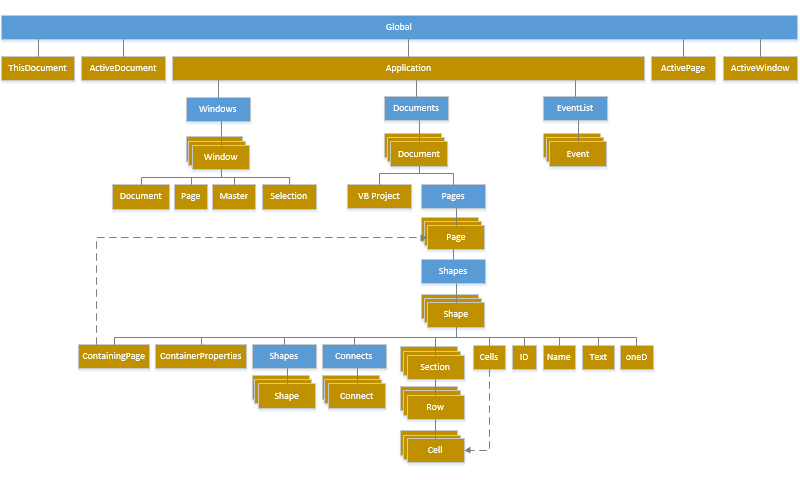
They are leveraged as follows:
- Application top-level object is used to access the collection of opened Windows, as well as get the global context for user action (to manage undo actions, more on this later..)
- ThisDocument object is implicitly used throughout the VBA code
- ActiveWindow/ActivePage/ActiveDocument objects are used to keep track of the window/page/document that the code manipulates
- Windows collection is used implement an event hook to detect when the active page changes
- EventList is used to register customized event notifications
- Documents collection is not accessed directly, but Document object is used to add an event hook executed when our document is opened to perform some initializations
- Pages collection is not accessed directly, but the (current) Page object is used to declare event hooks on many events related to modifications of the shapes contained on the page
- Shapes collection is used to lookup a particular shape based on its ID, and then Shape objects are used throughout the code to manipulate shape parameters and data
Each Shape has, among other things:
- Cells, arranged in Rows themselves arranged in Sections, they are the basic entities carrying shape information
- Connects collection that is used to examine incoming/outgoing links to/from a specific shape
- a Name (modifiable by the developer)
- a unique ID set by the internal Visio engine
Note: for historical reasons, shape are referred to as “Sheets”, therefore shape names are created with the name Sheet.xx, with xx being their ID.
So, in our example:
- Components, Containers, Interfaces, Connectors, and Criteria boxes are Shapes.
- They all live inside a Page, contained within a Document, and their Cells are modified in the context of an Application (the Visio program)
- The internal Visio engine, that manages all user actions, also executes our VBA code that acts upon these Cells
- our VBA code lives in two classes: the ThisDocument class, and the clsEventSink class (detailed later)
Shape types
When manipulating shapes programmatically, it is important to note that their are various shape types out there. A specific shape’s type is available in its Type parameter. In my case, I applied filtering here and there in the code to only care for:
- regular Shapes (
visTypeShape) - groups of Shapes (
visTypeGroup) - Pages/Masters (
visTypePage)
I filter out everything else (like Guides, Visio’s vertical/horizontal visual hints, or Bitmap images, or one othe many other types of shapes) from event callbacks to prevent unwanted effects. The complete list of Visio Shape types is available here.
Also, among regular Shapes, some are Containers, they are the ones with a non-null ContainerProperties object
Reading & writing shape data
Each Cell in a Shape has two important properties in our usage:
- Formula contains the…formula used to compute the cell value.
- Result (and its variants like ResultStr) stores…the result of the latest formula computation evaluation.
Reading and writing from/to Cells therefore boils down to accessing these two properties:
myShape.Cells("Prop.myPropName").Result
myShape.Cells("Prop.myPropName").Formula = "xyz"
Note: the Cells accessor takes a string parameter (the name of the target cell), while the CellSRC accessor takes the section/row number of the target cell as input.
Note: for several properties in the Visio object model, two accessors are accessible: <PropertyName> and <PropertyName>U. The version with the appended “U” allows to access the property via the Universal name, that is localization-independent, while the version without the U uses the localized name.
Note: a Cell’s result value is stored as a string in parameter ResultStr, and its last parameter allows to specify how to cast this string into a specific unit/type of value. Available Visio Units are defined here.
Note: Since Formula property is a string, sometime the syntax can get weird to actually use a string inside a formula. To avoid having to use confusing triple quotes, and easier way is to use CHR(34), as in e.g.:
Shape.CellsU("Prop." & connectorUserText).FormulaU = Chr(34) & Shape.Text & Chr(34)
Note: the Formula property can be used to cross-reference the property of another Shape as the source value in the computation, using the <ShapeName>!<PropertyName> syntax, as in e.g.:
shp.CellsSRC( ... ).FormulaU = containerShp.Name & "!FillForegnd"
Basic Event notification
The internal Visio engine emits many different Events when manipulating a diagram. It is then possible from VBA code to register to some of these events, by declaring a hook/callback to be executed when the event occurs. Three steps are required:
1) Use the WithEvents keyword to declare an object which events we want to be notified of. In this case, we want to track events occuring to the Windows object, and to the Page object
Dim WithEvents win As Visio.Windows
Public WithEvents pg As Visio.Page
2) Initialize these variables, using the applicable references for our execution context:
Set win = Visio.Application.Windows
Set pg = ActivePage
3) Declare event hooks/callbacks for these objects, using the following syntax
<var>_<predefined name of the event>
In practice I used the following event hooks:
- Document_DocumentOpened is used to trig one-time init actions upon opening our visio document. Note: there is no need for a “doc_” prefix and the associated
WithEventsdeclaration for this specific case, since inside theThisDocumentVBA class, this is implicit. - pg_CellChanged is used to detect (user-initiated) modifications of a shape data and react accordingly.
- pg_ShapeExitedTextEdit is used to detect when the user has just finished editing the name of a shape, to adjust this name programmatically (more on this later)
- win_WindowTurnedToPage is used to keep track of which Page is currently being worked on and refresh our pg variable to capture the right events.
- pg_ShapeAdded is used to recompute totals when a shape is added on the page.
- pg_ConnectionsAdded is used to update Interface data when links are being made
- pg_ConnectionsDeleted is used to update Interface data when links are being removed
- pg_ContainerRelationshipAdded is used to detect when a shape is created in / moved in a container
- pg_ContainerRelationshipDeleted is used to detect when a shape is removed / moved out of a container
Note: Pro versions of Visio include a very useful Event Monitor tool, tracing all events occurring in realtime, so you can figure out which event to capture for a specific action. Since this tool is not available in the Standard version, I downloaded an evaluation version of Visio Professional, ran a few tests, identified the relevant events, then went back to developing in my Standard version. Browsing the reference documentation works too, but I’m lazy.
Note: the BeforeSelectionDelete event might have been useful to me, except it gets called before the selected shape gets deleted, and is therefore not a good place to trig recomputation of data: since the shape is not deleted yet, everything is still unchanged data-wise…therefore, the need for custom events.
Custom Event notification
For performance reasons, not all possible events are being managed by default by the Visio engine. For my example, I needed to have access to two of these special events: onShapeDeleted and onBeforeShapeTextEdit. It is a bit more complex than just the WithEvents declaration approach used for regular/default events. The required steps are:
1) Create a custom Event sink class, implementing the IVisEventProc_VisEventProc. Hence the presence of the clsEventSink VBA class in my project.
Implements Visio.IVisEventProc

Private Function IVisEventProc_VisEventProc( _
    ByVal nEventCode As Integer, _
    ByVal pSourceObj As Object, _
    ByVal nEventID As Long, _
    ByVal nEventSeqNum As Long, _
    ByVal pSubjectObj As Object, _
    ByVal vMoreInfo As Variant) As Variant

    ' Custom event handler
    Select Case nEventCode
        Case visEvtCodeShapeDelete
            Debug.Print "Custom EVENT visEvtCodeShapeDelete received"
            ThisDocument.onShapeDeleted
        Case visEvtCodeShapeBeforeTextEdit
            Debug.Print "Custom EVENT visEvtCodeShapeBeforeTextEdit received"
            ThisDocument.onBeforeShapeTextEdit pSubjectObj
        Case Else
            Debug.Print "EVENT " & nEventCode & " received"
    End Select

End Function
2) Instanciate this event sink and register it to the global EventList using the AddAdvise function, passing the required specific event code as a parameter:
' declare our custom event handler (implemented in our clsEventSink class)
Dim eventHandler As clsEventSink
Set eventHandler = New clsEventSink

' Attach our custom event handler to the appropriate event codes:
ThisDocument.EventList.AddAdvise visEvtCodeShapeDelete, eventHandler, "", ""
ThisDocument.EventList.AddAdvise visEvtCodeShapeBeforeTextEdit, eventHandler, "", ""
At the time of writing, the full list of these event codes was available here in the Visio developer documentation.
Custom shape data
- Components have custom volume/cost/mass/power data, stored in Cells named
Prop.volume,Prop.cost,Prop.mass, andProp.power - Containers have the same properties, since they themselves can have a mass/cost/power/volume (think: a naked PCB)
- Connectors have custom associated data to store the number of signals being carried
Prop.nbSignals, as well as other data to keep track of the user text for the connector, since it gets dynamically reconstructed any time the nb of signal changes - Interfaces have custom data to track the number of internal and external signals passing through to them, stored in
Prop.interfaceInternalLinksandProp.interfaceExternalLinks - Criteria boxes have custom data to store their associated criteria value:
Prop.criteriavalue
Custom dynamic connector text
The displayed text on each connector is dynamically computed, based on the name that the user set for this link, completed by the value of the connector data representing the number of signals being carried. To achieve this:
- the connector name set by the user is stored in one of the shape data parameter
Prop.userName -
when receiving the
BeforeShapeTextEditevent, the code temporarily restores the original connector name so that the user can edit it without bothering about the computed part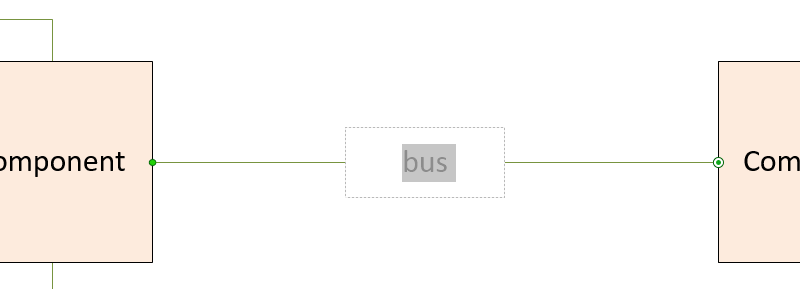
-
when receiving the
ShapeExitedTextEditevent, the code recomputes the full text based on the newly set user text, and adding the current signals data value within parenthesis - we also capture the
CellChangedevent, and recompute the text in case the number of carried signals was changed by the user (from the shape data window)
Automated coloring & counting
The color of Connectors and Interfaces in a given container are dynamically adjusted to the color of the container:
Interface coloring & counting implementation
If the Interface is inside a container:
- its color is adjusted to the color of the container by assigning a reference to the
FillForegndparameter of the parent container inside the formula for the Interface’sFillForegnd. Note: an additional element in the formula consists in using the TINT function to increase the luminosity of the source color.
CellsU("FillForegnd").FormulaU = "TINT(" & containerShp.Name & "!FillForegnd" & ", 50)"- its internal/external signal counts are set such that internal signals correspond to the total number of signals coming from connectors inside the container, while external signals correspond to the total number of signals coming from connectors outside the container:
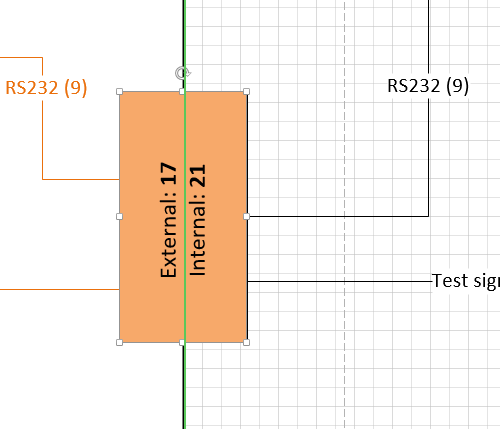
If the Interface is outside any container:
- its color is adjusted to a default value:
CellsU("FillForegnd").FormulaU = ExternalInterfaceFillColor- and all its signal are then external by definition:
Connector coloring implementation
If the Connector is inside a container:
- its color is adjusted to the color of the container, by assigning a reference to the
FillForegndparameter of the parent container inside the formula for the Connector’sLineColor
CellsU("LineColor").FormulaU = containerShp.Name & "!FillForegnd"- its text color is also adjusted, by assigning a reference to the
FillForegndparameter of the parent container inside the formula for the Connector’s text color:
CellsSRC(visSectionCharacter, 0, visCharacterColor).FormulaU = containerShp.Name & "!FillForegnd"If the connector is outside any container, its color is adjusted to a default value in a similar way:
CellsU("LineColor").FormulaU = ExternalConnectorLineColor
CellsSRC(visSectionCharacter, 0, visCharacterColor).FormulaU = ExternalConnectorLineColor
Navigating connectors
As mentioned earlier, shapes can be connected to other shapes via connectors, and connectors can be glued to shapes’ connection points. From a code standpoint,
- An array of IDs of shapes glued to a given shape is accessible through the
GluedShapesfunction. Since I am mostly interested in counting connectors glued to an Interface shape, I used thevisGluedShapesIncoming1DandvisGluedShapesOutgoing1Dfilter codes to only look for these, and then merged both ID lists.
arySourceIDs = shp.GluedShapes(visGluedShapesIncoming1D, "")
aryTargetIDs = shp.GluedShapes(visGluedShapesOutgoing1D, "")- Similarly, the
ConnectedShapesfunction returns an array of ID a shapes connected to the target shape.
For this example:
The result is as follows:
Shapes glued to shape Sheet.2:
              Connector 2(shapeId=7, Name=link.7)
              Connector 1(shapeId=8, Name=link.8)
Shapes connected to shape Sheet.2:
              Shape B(shapeId=3, Name=Sheet.3)
Shapes glued to shape Sheet.3:
              Connector 2(shapeId=7, Name=link.7)
              Connector 1(shapeId=8, Name=link.8)
              Connector 3(shapeId=9, Name=link.9)
Shapes connected to shape Sheet.3:
              Shape A(shapeId=2, Name=Sheet.2)
In my case, I was also interested in examining the other end of each connector glued to a shape, to figure out if something is connected there. Each Connector has a list of Connects, that represent the link between a connector endpoint and an anchor shape. A Connect has two parameters, a FromSheet and a ToSheet, corresponding to the two shapes being attached.
Undo management
One tricky bug I encountered only happened while doing a very specific action, and then UNDO-ing it (e.g. hitting Ctrl-Z). I finally learned that it was actually much simpler (and good practice) to prevent all my custom VBA callbacks from executing during undo operations: indeed, what the callbacks do is process data and in the end update some of the shapes’ cells with new values. During Undo, the Visio internal engine reverts cells values to whatever they where before, making it completely unnecessary to recompute anything. The top-level Application object provides the IsUndoingOrRedoing boolean variable, which can be used to just return from the callback when the execution context is an UNDO operation.
Applicable documentation is available here.
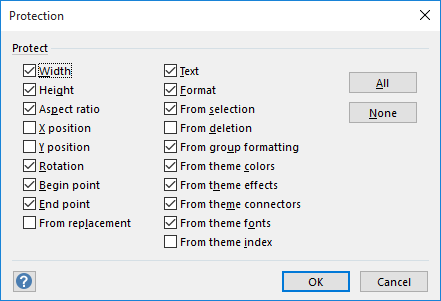
Shape protection
For some of the elements on the diagrams, it may be useful to lock user modifications for some aspects of the shape. For example, there is no good reason to let the user resize or change the text inside the criteria boxes. Locking is achieved through the “Protection” window for the shape, available in the Developer tab. Below is the example setting for criteria boxes:
General Visio Tips
Glue anywhere
All Visio Shapes have predefined connection points for connectors:
However, quite often for complex diagrams more connection points are required for a visually pleasing result. There are two ways to address this need:
-
Creating additional connection points, by selecting the shape, selecting the connection point tool, and clicking somewhere on the shape’s perimeter. This approach gets tiresome pretty quickly though…
-
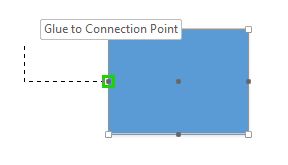
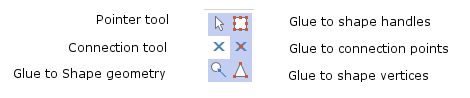
A much simpler way is to enable the
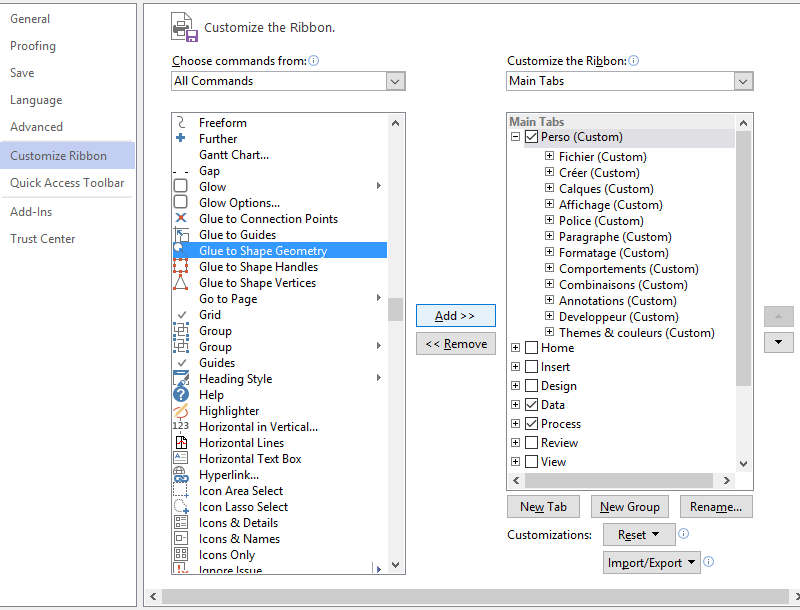
Glue to Shape Geometryoption. For some reason, not only is this not enabled by default, but the associated button/icon to activate it is not available anywhere in the Ribbon either. To add it in the Ribbon, right-click on it, selectCustomize the Ribbon, then display select “All Commands” on the left, look for theGlue to Shape Geometryentry and insert it somewhere in a custom group.
For convenience, I also included the other available glue option buttons in the same tab:
When Glue to Shape Geometry is active, connectors can now be glued anywhere on the perimeter of a shape:
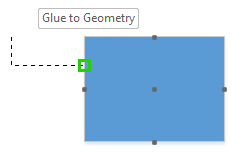
Major productivity boost when dealing with tens of connections !
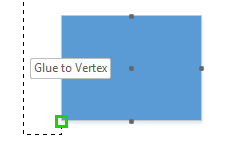
The Glue to Vertex option is not as interesting, but still good to know:
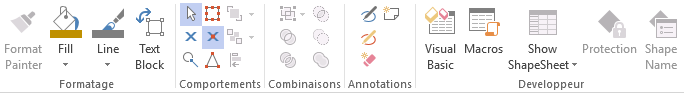
Customize the Visio Ribbon
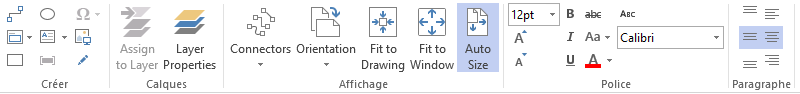
Over time I came to dislike having to navigate through the ribbon tabs, and since I typically use the same limited subset of commands 99% of the time, I customized the ribbon to have them all in a single tab, and only display this tab:
Also, the Import/Export feature in the Ribbon customization menu is nice, to save your current customization layout, for instant customization of a fresh Visio install on another PC or something.
Useful resources
- The Microsoft Visio Automation Reference documentation on MDSN is surprisingly good.
- But without a doubt, the Visio Guy site/forum is the most useful place for all Visio developers.
- the Visio VBA object reference is available here
Lessons learned
- This was my very first experience with VBA and I expected to be disappointed, but it turned out to be quite OK in fact. The only grudge I have is with the VBA user interface inside Visio, which has not been brought to today’s IDE standards.
- I only scratched the surface of the automation possibilities in Visio, it really opened my eyes to their extent.