
Dynamic dataflows in Visio diagrams with VBA
After a first experience with Visio automation (see here) and some external motivation (thanks Kevin for the inspiration!), it was time to dig further down the rabbit hole of what VBA (among other languages) can bring to Visio to implement dynamic diagrams, and have fun along the way.
Usecase & features
This little prototype simulates a process flow:
- start points generate a specific quantity of (anonymous/generic) items
- flows carry these items towards/between process nodes in a directed graph
- nodes process incoming flows of items based on adjustable parameters, compute local statistics, and then propagate items/data to outgoing flows
- user input fields can be added in nodes to adjust the processing parameters
- user display fields can be added in nodes to show the value of various node properties
- end points sink specific flows, displaying final data values after traversing the graph
- global totals that compute data totals for a given property across the whole graph
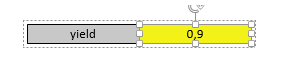
User fields
Object data are internally stored as Visio shape data, but I wanted a more direct way to modify configurable values than having to open the shape data menu, and edit the appropriate line. Also, while some shape data are intended to be modified by user, others are computation results intended to be displayed but not modified, and others still are shape data supporting the implementation itself that should not be modified manually.
So two dedicated objects are available: one for user inputs:
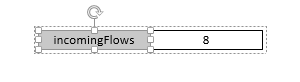
The other for value display only:
Start points
Each start point has two properties:
- a flow name
- an initial quantity of items to be injected into the flow
Flows
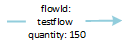
Each flow has a name, and carries a given quantity of items between nodes.
Nodes
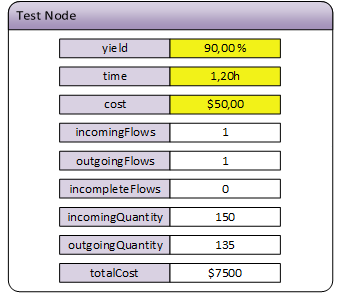
Node are steps in the data flow, that process incoming flows to generate corresponding outgoing flows. For the sake of simplicity, this prototype only includes two trivial processing functions: summing and multiplying.
In this example, two properties are summable along the flows (cost and time) and one property is multipliable along the path (yield). Also, the Node applies the yield factor to the incoming quantity of items, and propapates only the resulting number of items towards the outgoing flow.
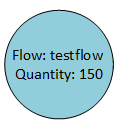
End points
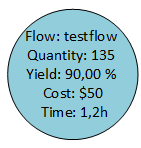
One endpoint is required for each flow, and it displays the computed data for this flow: number of items that remain after going through the nodes, and total cost/time/yield along the flow path.
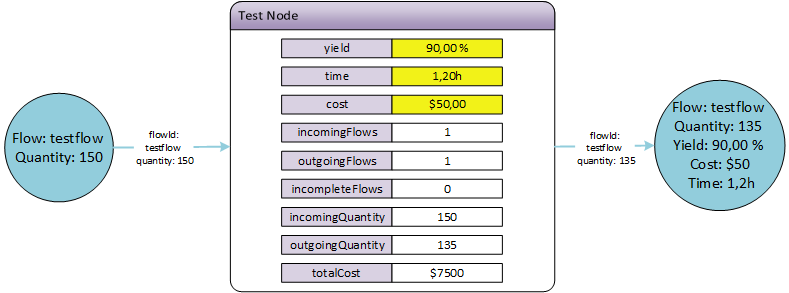
Minimal flow
So the minimal valid pattern is one start point, one flow to a node, one flow to an endpoint, and one endpoint, all of them having the same flow name.
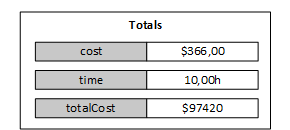
Global totals
These are just user display fields placed outside any node, that compute totals for a given property across the whole graph
Coloring
It soon became clear that on any non-trivial graph, visually following a given flow became difficult. So I implemented an automatic coloring of the flows, based on the fill color of the associated start point or end point. If either the fill color of a start point or the fill color of an endpoint is modified manually, this color is applied end-to-end on this flow
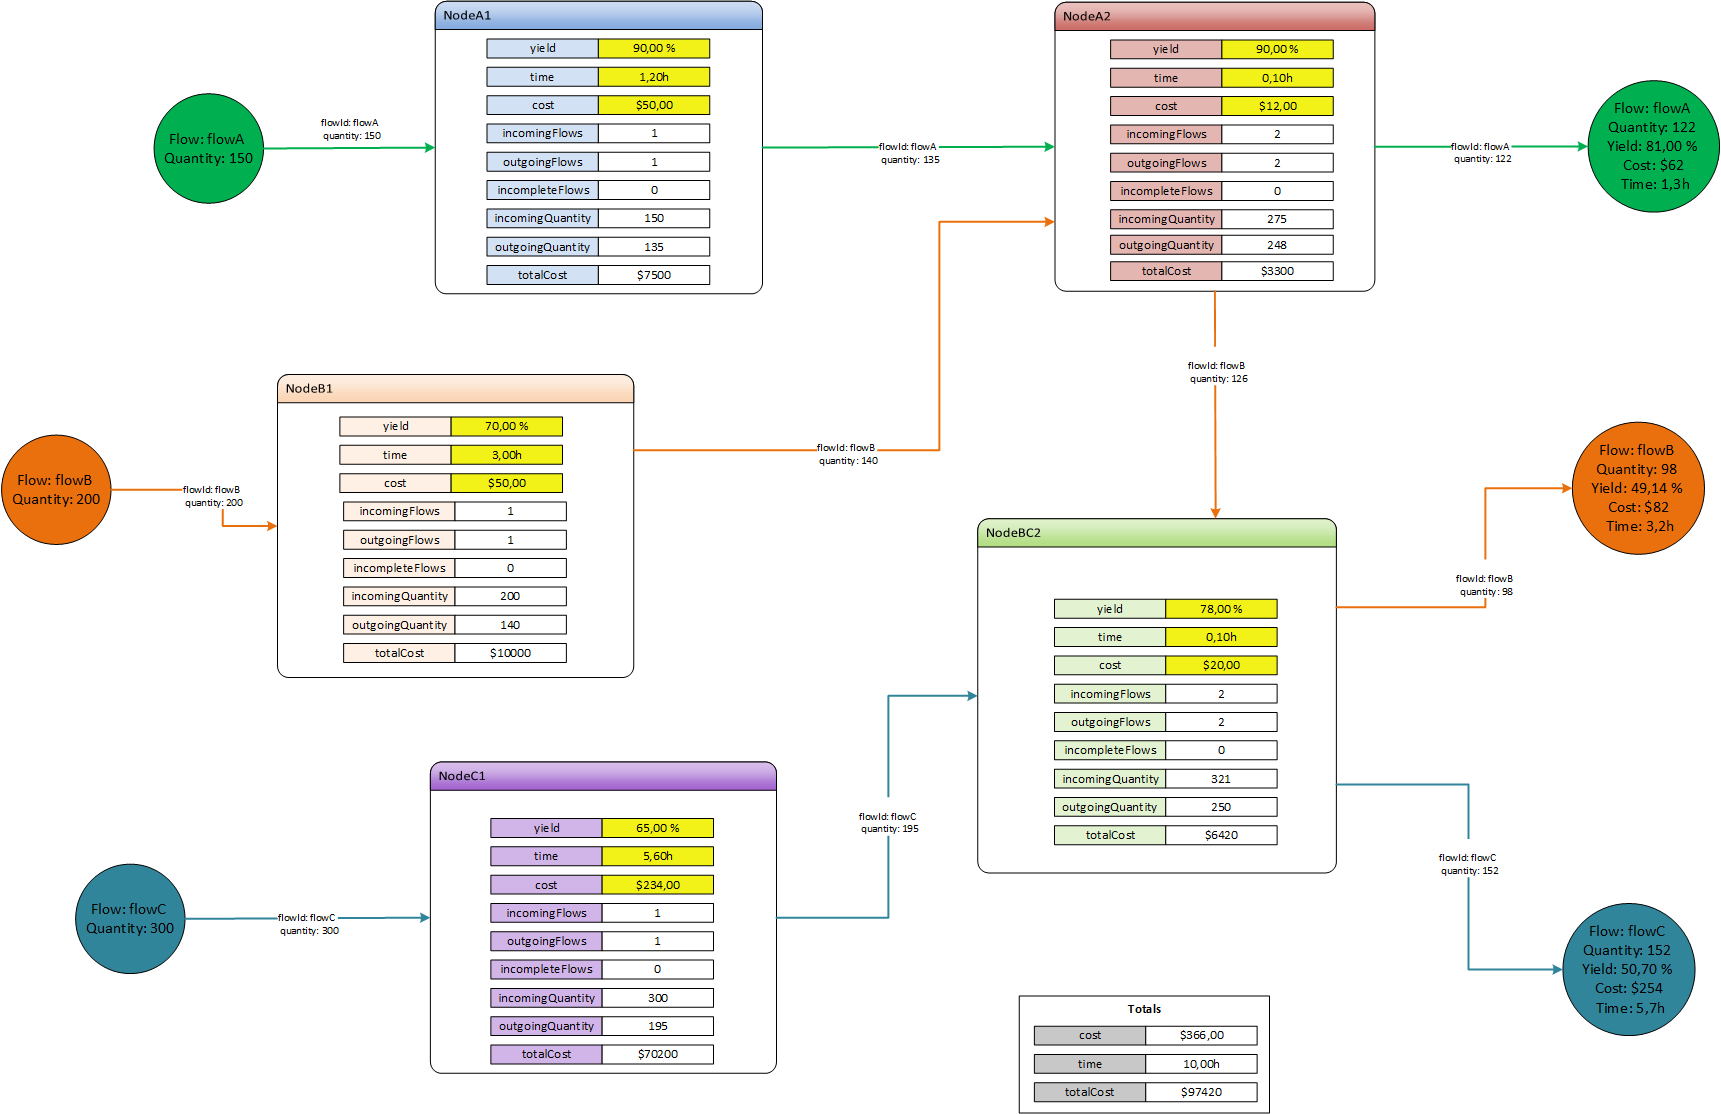
Example
Here is a more realistic example with chained nodes, multiple flows, and automatic coloring:
Dynamic diagram update
Since all objects in the graph have associated data that can potentially impact the results, the difficulty is to make sure that everytime one data is modified (either by the user or automatically), adequate recomputations occur. The hard way to do this is to identify individual dependencies of each object’s data and recompute dependent data upon modification, and the lazy way (which I chose, obviously) is just to recompute everything each time something changes. The performance is not as good, but I did not care too much about it in the context of this experimentation, and it simplifies the code a lot and the debugging a WHOLE lot.
So basically, everytime an object is added/deleted, a flow connected/disconnected from a shape, or a user data modified manually, a two-step recompute happens:
- Backtrace each endpoint, looking for a valid/complete path back toward the associated flow’s start point.
- Now that valid data paths have been recomputed, propagate items/data from each startpoint to its endpoint, through the graph, applying the effects of Nodes included in the path. Updates are propagated along the flow, up to the final update which is the endpoint result data.
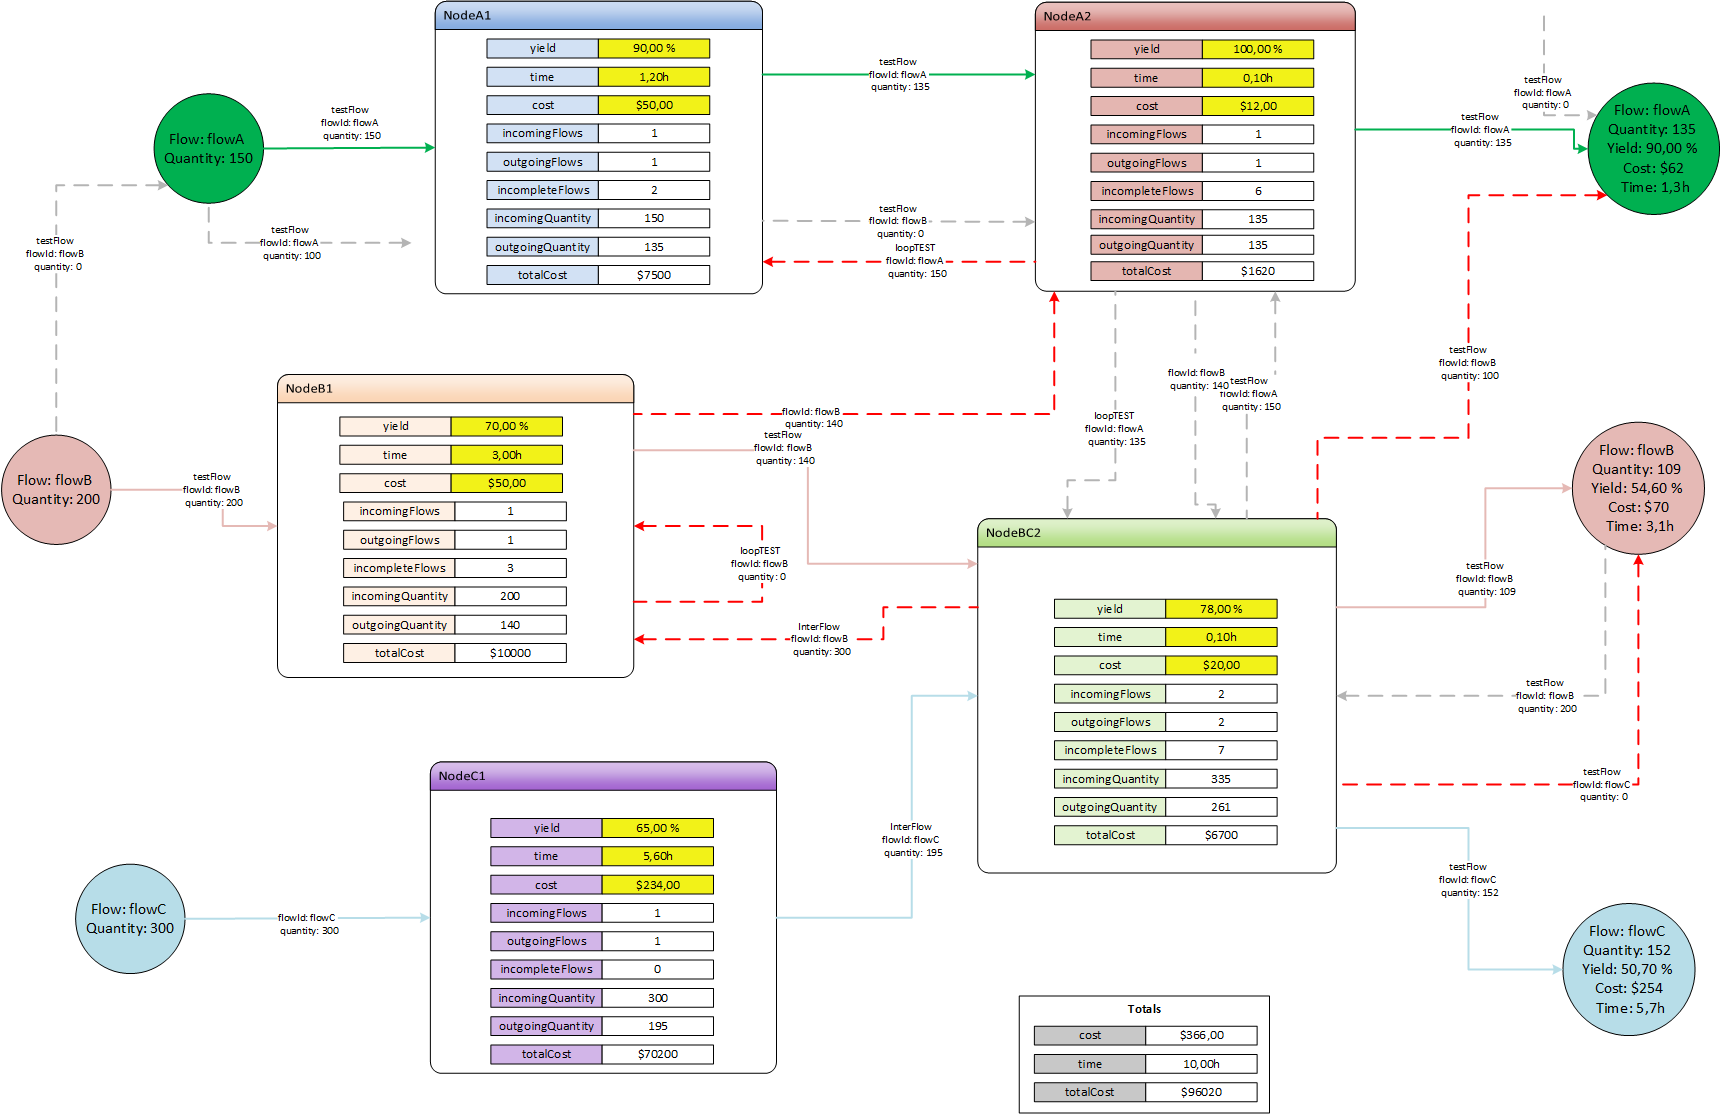
Error checking
As in any directed graph, unintended loops in data flows are bound to happen, so the application detects them, stops computation on these paths to avoid infinite processing, and highlights them to let the user correct the situation manually. Also,
- looping flows are highlighted in red
- invalid flows are highlighted in red (e.g. multiple flows with the same name on a startpoint or endpoint)
- incomplete flows are set to dashed grey lines (i.e. flows that may become valid but that do not belong to any valid/complete dataflows)
VBA implementation
I reused the baseline implementation from this other project, so this is still using Visual Basic for Applications (VBA). All Visio-specific base principles (shape types, shape data, and how to programmatically use shape relationships to parse diagrams) are described there, so the information below is the part specific to this project.
I did a major refactoring of the code at the same time, to make it a little more structured, though it is still hobbyist-grade code and would probably make a seasoned VBA developer have a heart attack just by looking at it.
Walking through connected shapes
Even though Visio provides a ConnectedShapes functions that returns shapes connected to a given shape, but in my case to enumerate the connectors (flows) on a node, I used the GluedShapes function instead, filtering for 1D-shapes.
The next difficulty is to figure out the direction of the flow. Each visio connector has a “start” point and an “end” point, however the style of each end of the connector can be either nothing or an arrow (or some other style), so there could very well be an arrow on the “start” side and nothing on the end side. The code looks for other internal Visio properties to determine the direction of a connector with respect to a shape it is connected to.
Managing groups
One difficulty with using Visio containers for nodes, is that a container is actually a group object, that has a title and a body inside it. So when a Visio connector is visibly connected to a container, depending on where the connection is made, the connector ends up being glued either to one of the container’s glue handles, OR to the title inside the container group, OR to the body inside the container group. So for example to properly compute the number of incoming flows, the code checks if the shape the flow is connected to has a parent group (and whether this parent is a node)
Logging
I included a tracing function that can be enabled to log execution to file, but the amount of generated lines upon recomputes is such that it is usually much more convenient to use the VBA debugger with breakpoints.
Performance
Performance is poor, as is to be expected with my brutal update logic, and unoptimized code. It takes about a second to recompute the example graph (but it is still cool to be able to disconnect a flow and see the maze of redundant paths get dynamically recomputed)
Source Code
The Visio file containing the VBA source code and an example usecase is available here
Useful resources
- The Microsoft Visio Automation Reference documentation on MDSN is surprisingly good.
- But without a doubt, the Visio Guy site/forum is the most useful place for all Visio developers.
- the Visio VBA object reference is available here
Lessons learned
- That’s it. I am hooked now, I just love Visio and its endless automation capabilities. I am not exactly sure how I got carried away from the first few lines of VBA to the 2500 lines of this (buggy) code, but I sure enjoyed the ride.