Arduino tips and tricks
Below is a set of notes to myself regarding various Arduino debugging tips and tricks
- Re-flash the bootloader
- Enable non-root access to serial port(s) in Arduino IDE
- Enable full compilation traces
- Measure execution time
- Debugger
- Memory optimisation
- Figuring out where memory went
- Measuring free SRAM at execution time
- Checking symbols and their sizes
- SRAM optimization: the PROGMEM directive
- SRAM optimization: using the F() macro
- Checking the linker’s memory map
- Checking stack usage at runtime
- Stack size optimisation: buffer sizes
- Stack size optimisation: reduce function nesting
- Stack size optimisation: un-inlining functions
- Dumping assembly code
Re-flash the bootloader
Sooner or later, one gets the dreaded avrdude:stk500_recv():programmer is not responding error when trying to reprogram an arduino. Sometimes it’s the IDE/port, but sometimes it indicates that the bootloader in the Arduino is toast.
Luckily, it is very easy to re-burn the bootloader using another Arduino:
Connect the “master” Arduino” and the “target” Arduino like this:
| Master => | Target |
| VCC/5V => | Raw (if 3.3V target) or VCC |
| GND => | GND |
| Pin 10 => | RST |
| Pin 11 => | Pin 11 |
| Pin 12 => | Pin 12 |
| Pin 13 => | Pin 13 |
Note: basically this boils down to:
- supplying power to the target board
- connect the two using an SPI connection (pins 11/12/13 correspond to SCK/MOSI/MISO signals)
- giving a mean for the master to reset the target upon completion
Then, from the Arduino IDE,
- select the type of the master arduino (e.g. Arduino Uno) and the serial port,
- open the “ArduinoISP” sketch (File -> Examples -> ArduinoISP ->ArduinoISP)
- upload this sketch to the master board
- change the board type to the one of the target (e.g. Arduino Pro or Pro Mini)
- adjust the speed and processor (Tool-> Processor -> ATmega328 (xxV, yyMHz)
- select the master of the programmer (Tools > Programmer -> Arduino as ISP)
- burn the bootloader on the target (Menu -> Burn Bootloader)
and voilà.
Enable non-root access to serial port(s) in Arduino IDE
When launching the arduino IDE without root privileges, by default access to serial ports to communicate with the boards is not permitted and will produce an error when trying to flash a program. The following command allows to grant access to user [username] to serial ports, e.g. /dev/ttyS0 or /dev/ttyACM0:
sudo usermod -a -G dialout [username]
Then logout, log back in, launch arduino IDE normally, and access should be possible.
Enable full compilation traces
Whenever detailed compilation traces are required in the arduino IDE, just head to
"File" => "Preferences" => "Show verbose output during compilation"
Measure execution time
Very classical way to profile arduino execution time:
unsigned long StartTime = millis();

[code to be measured]

unsigned long CurrentTime = millis();
unsigned long ElapsedTime = CurrentTime - StartTime;
Serial.print("Time:"); Serial.println(ElapsedTime);
(obviously the Serial.print statements slow down the overall execution)
Debugger
For the non-trivial arduino projects, there comes a time when having a serious debugging tool is in order. I checked the Visual Micro plugin for Visual Studio and Atmel Studio, it is definitely worlds apart from the native Arduino IDE, and very reasonably priced. However, I happen to use 8-bit AVR-based arduinos mostly, which do not include HW debugging support (JTAG) anyway, so the “debugger” function in this case is a glorified logging system. There is still the very nice integration in Visual Studio, but I also happen to work from Linux mostly.
There is also the possibility to roll out a flavor of gdb on the arduino, but with the memory limitations of 8-bit AVRs, there is a high chance that the memory footprint would be unacceptable.
So in the end I realized I had no other choice than debugging the old-fashioned way (Serial traces & using my brains)
Memory optimisation
A wonderful summary of Arduino memory management and related issues is available here.
TLDR:
- arduinos have three types of memory
- program memory (Flash, non volatile)
- dynamic memory (SRAM, volatile)
- EEPROM (non-volatile)
- amount of used program memory shows up in the compiler output, so it is clear enough when reaching the limit, and optimizing is obvious (reducing amount of generated code one way or the other)
- amount used dynamic memory is trickier to figure out, as it always is, since it depends on execution flow and what the code does and how.
- at the bottom of SRAM, registers are mapped
- on top of that, global static variables are stored (initialized variables in data segment, and uninitialized variables in bss segment)
- on top of that lives the heap, used by dynamic memory allocations/deallocations (hint: don’t use those at all)
- then starting from the other end of the SRAM (the top), lives the stack, where all local variables live as well as parameters passed by functions and function/interrupts callstack itself. The stack grows dynamically downward, i.e. in the free memory area and in the direction of the heap end/start.
Here is an example for an ATmega328-based arduino, with 2048 bytes of SRAM:
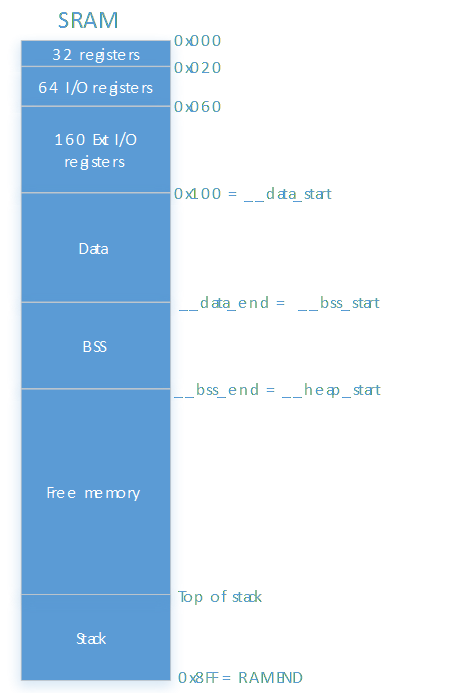
Weird behavior of an Arduino program appearing right after modifying something apparently unrelated in the program is (very) likely to be the result of running out of SRAM (i.e. stack space and heap space colliding)
Figuring out where memory went
First of all, it is useful to check the executable file itself and see what memory space it will occupy once loaded. Enter the avr-size command, usually located under arduino-x.y.z/hardware/tools/avr/bin
./avr-size /tmp/arduino_build_xxxxxx/sketch.ino.elf

text    data   bss   dec     hex filename
17038   640    750   18428   47fc /tmp/arduino_build_xxxxxx/sketch.ino.elf
- text is code, stored in Flash
- data and bss live at the bottom of the SRAM: in this example, on an ATMega328 with 2048 bytes of SRAM, only 2048-640-750= 658 bytes are left for dynamic memory allocations (malloc) AND execution stack.
Measuring free SRAM at execution time
The function below returns the delta between top of the heap and bottom of the stack, i.e. the remaining amount of free SRAM:
int freeRam ()
{
  extern int __heap_start, *__brkval;
  int v;
  return (int) &v - (__brkval == 0 ? (int) &__heap_start : (int) __brkval);
}
Checking symbols and their sizes
The following command (executed from arduino-x.y.z/hardware/tools/avr/bin) will return the list of symbols (code & data) in the executable:
./avr-nm /tmp/arduino_build_xxxxxx/sketch.ino.elf | sort
More interestingly, the following command will list data symbols, by decreasing size:
./avr-nm -Crtd --size-sort /tmp/arduino_build_xxxxxx/sketch.ino.elf | grep -i ' [dbv] '
e.g.:
00000512 D _ZL6buffer.lto_priv.58
00000242 B ES
00000157 B Serial
00000046 B display
00000034 B TwoWire::txBuffer
00000034 B TwoWire::rxBuffer
00000034 b twi_txBuffer
00000034 b twi_rxBuffer
00000034 B twi_masterBuffer.lto_priv.62
00000032 b gWDT_entropy_pool
00000032 b gWDT_buffer
00000024 d vtable for Adafruit_SSD1306
00000016 d vtable for TwoWire
00000016 d vtable for HardwareSerial
00000012 b Wire
In this example, 512 bytes of memory is being taken by the “buffer” object on the code, and e.g. 157 bytes are taken by the Serial object.
SRAM optimization: the PROGMEM directive
The PROGMEM keyword tells the compiler to store the data structure it is associated to, into program memory (flash), freeing the corresponding SRAM where they would otherwise end up living.
const char mydata[] PROGMEM  = {"looooooooooong string of data in here"};
char myChar;
int len = strlen_P(mydata);

for (k = 0; k < len; k++)
{
  myChar =  pgm_read_byte_near(mydata + k);
  // do whatever
}
SRAM optimization: using the F() macro
Wrapping initialised strings in the F() macro will reap the PROGMEM benefits (i.e. free-up corresponding SRAM)
Serial.println(F("hardcoded string");
Checking the linker’s memory map
Linker memory map file are not generated by default. To tell the linker to generate it, the linker flags need to be modified. When using the arduino IDE, there is a platform.txt file somewhere in the arduino folder that contains compiler and linker flags, e.g.
/arduino-1.x.y/hardware/arduino/avr/platform.txt
To generate memory map, just add
-Wl,-Map,{build.path}/linker.map
at the end of the
compiler.c.elf.flags
line, then save the file, re-launch IDE and recompile. A linker.map text file should have been generated in the project’s temp build directory (on linux, usually /tmp/arduino_build_xxxxxx)
A very helpful viewer tool for windows and linux is available here.
Checking stack usage at runtime
The current stack size at a given point during execution can be determined using the SP (stack pointer) value, and comparing it to the end of SRAM (where the stack begins):
Serial.print("Stack size: "); Serial.println(RAMEND - SP);
Also, it is often interesting to determine the maximum size that the stack has previously reached, and this can be done using the good old “stack canary” trick.
At the very beginning of execution (ideally in bootloader, but doing it as the first step when entering setup() works just fine), fill the free memory (i.e. memory adresses starting after the BSS segment, and up to the stack pointer) with a known value:
#define STACK_CANARY_VAL 0xfd

extern char *__bss_end;
extern uint8_t  __stack;

uint8_t *p = (uint8_t *)&__bss_end;
while(p <= SP)
	*p++ = STACK_CANARY_VAL;
Later, the following function can be used to walk the same memory addresses, and stop at the first address that does not contain the canary value (because it was overwritten by the bottom of the stack): this provides the margin between the highest stack size (so far) and the original amount of free SRAM. The smaller the value, the highest the likelyhood of a (future) collision between the stack and the BSS (i.e. horrible unexplained crashes)
uint16_t StackMarginWaterMark(void) {
    const uint8_t *p = (uint8_t *)&__bss_end;
    uint16_t c = 0;

    while(*p == STACK_CANARY_VAL && p <= (uint8_t *)&__stack) {
        p++;
        c++;
	}
	return c;
}
All of this only works if no malloc() are used in the code.
Stack size optimisation: buffer sizes
An obvious way to reduce the stack size is just to reduce that amount and size of local variables in functions. It is often worth going over all local arrays used inside functions, and make them the smallest size compatible with what the code is doing. This of course requires to have a perfect control over the max amount of data (e.g. string lengths…) that will go in these arrays, or dreaded buffer overflows will follow.
Stack size optimisation: reduce function nesting
This is also obvious, but since the max level of function call nesting often determines the worst case stack size, flattening the functions call tree wherever possible helps minimizing the max stack size, therefore minizes the likelyhood of stack/heap collision.
Stack size optimisation: un-inlining functions
Most of the time function inlining is fine to optimize performance, however in the case of a lot of small functions using local buffers, inlining results in a huge cumulative stack size when main loop is called, which may be a problem if free memory is low. To force the compiler to NOT inline functions, just add the __attribute__ ((noinline)) in the function prototype:
void __attribute__ ((noinline)) foo()
{

}
Dumping assembly code
For the rare case where compiled assembly code would need to be visualized, the avr-objdump in the directory arduino-x.y.z/hardware/tools/avr/bin can be used:
./avr-objdump -m avr -C -S /tmp/arduino_build_xxxxxx/BlueKey.ino.elf > /tmp/dump.asm